Colombian vs Immigrants from Romania Unemployment Among Ages 55 to 59 years
COMPARE
Colombian
Immigrants from Romania
Unemployment Among Ages 55 to 59 years
Unemployment Among Ages 55 to 59 years Comparison
Colombians
Immigrants from Romania
4.7%
UNEMPLOYMENT AMONG AGES 55 TO 59 YEARS
83.6/ 100
METRIC RATING
136th/ 347
METRIC RANK
4.7%
UNEMPLOYMENT AMONG AGES 55 TO 59 YEARS
85.3/ 100
METRIC RATING
132nd/ 347
METRIC RANK
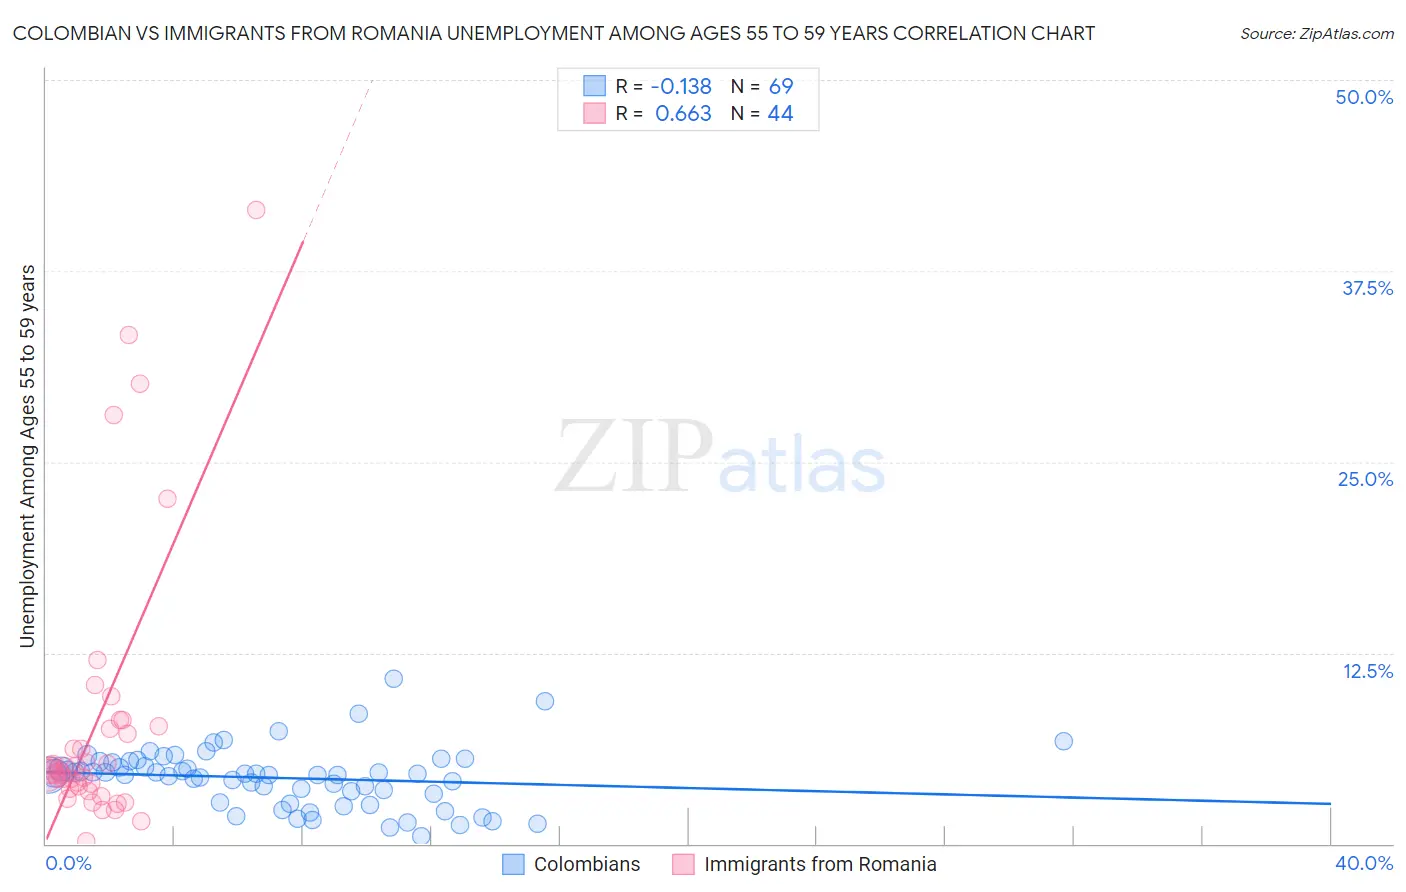
Colombian vs Immigrants from Romania Unemployment Among Ages 55 to 59 years Correlation Chart
The statistical analysis conducted on geographies consisting of 390,162,516 people shows a poor negative correlation between the proportion of Colombians and unemployment rate among population between the ages 55 and 59 in the United States with a correlation coefficient (R) of -0.138 and weighted average of 4.7%. Similarly, the statistical analysis conducted on geographies consisting of 247,085,133 people shows a significant positive correlation between the proportion of Immigrants from Romania and unemployment rate among population between the ages 55 and 59 in the United States with a correlation coefficient (R) of 0.663 and weighted average of 4.7%, a difference of 0.13%.
Unemployment Among Ages 55 to 59 years Correlation Summary
| Measurement | Colombian | Immigrants from Romania |
| Minimum | 0.50% | 0.20% |
| Maximum | 10.8% | 41.5% |
| Range | 10.3% | 41.3% |
| Mean | 4.3% | 7.9% |
| Median | 4.5% | 4.7% |
| Interquartile 25% (IQ1) | 3.0% | 3.7% |
| Interquartile 75% (IQ3) | 5.4% | 7.6% |
| Interquartile Range (IQR) | 2.4% | 4.0% |
| Standard Deviation (Sample) | 1.9% | 9.0% |
| Standard Deviation (Population) | 1.9% | 8.9% |
Demographics Similar to Colombians and Immigrants from Romania by Unemployment Among Ages 55 to 59 years
In terms of unemployment among ages 55 to 59 years, the demographic groups most similar to Colombians are Delaware (4.7%, a difference of 0.0%), Slavic (4.7%, a difference of 0.010%), Panamanian (4.7%, a difference of 0.040%), Immigrants from Switzerland (4.7%, a difference of 0.050%), and Romanian (4.7%, a difference of 0.060%). Similarly, the demographic groups most similar to Immigrants from Romania are Immigrants from Thailand (4.7%, a difference of 0.010%), Immigrants from Netherlands (4.7%, a difference of 0.060%), Panamanian (4.7%, a difference of 0.090%), Greek (4.7%, a difference of 0.12%), and Slavic (4.7%, a difference of 0.12%).
| Demographics | Rating | Rank | Unemployment Among Ages 55 to 59 years |
| Lithuanians | 88.8 /100 | #124 | Excellent 4.7% |
| Immigrants | Malaysia | 87.9 /100 | #125 | Excellent 4.7% |
| Immigrants | Serbia | 87.8 /100 | #126 | Excellent 4.7% |
| Icelanders | 87.7 /100 | #127 | Excellent 4.7% |
| Pennsylvania Germans | 87.1 /100 | #128 | Excellent 4.7% |
| Immigrants | Sweden | 86.8 /100 | #129 | Excellent 4.7% |
| Greeks | 86.6 /100 | #130 | Excellent 4.7% |
| Immigrants | Thailand | 85.4 /100 | #131 | Excellent 4.7% |
| Immigrants | Romania | 85.3 /100 | #132 | Excellent 4.7% |
| Immigrants | Netherlands | 84.5 /100 | #133 | Excellent 4.7% |
| Panamanians | 84.1 /100 | #134 | Excellent 4.7% |
| Slavs | 83.7 /100 | #135 | Excellent 4.7% |
| Colombians | 83.6 /100 | #136 | Excellent 4.7% |
| Delaware | 83.6 /100 | #137 | Excellent 4.7% |
| Immigrants | Switzerland | 82.9 /100 | #138 | Excellent 4.7% |
| Romanians | 82.7 /100 | #139 | Excellent 4.7% |
| Immigrants | Indonesia | 80.2 /100 | #140 | Excellent 4.8% |
| French Canadians | 80.1 /100 | #141 | Excellent 4.8% |
| Immigrants | Norway | 79.8 /100 | #142 | Good 4.8% |
| Ukrainians | 78.6 /100 | #143 | Good 4.8% |
| Immigrants | Asia | 77.8 /100 | #144 | Good 4.8% |