Cheyenne vs Immigrants from Greece 8th Grade
COMPARE
Cheyenne
Immigrants from Greece
8th Grade
8th Grade Comparison
Cheyenne
Immigrants from Greece
96.1%
8TH GRADE
93.3/ 100
METRIC RATING
129th/ 347
METRIC RANK
96.0%
8TH GRADE
85.9/ 100
METRIC RATING
141st/ 347
METRIC RANK
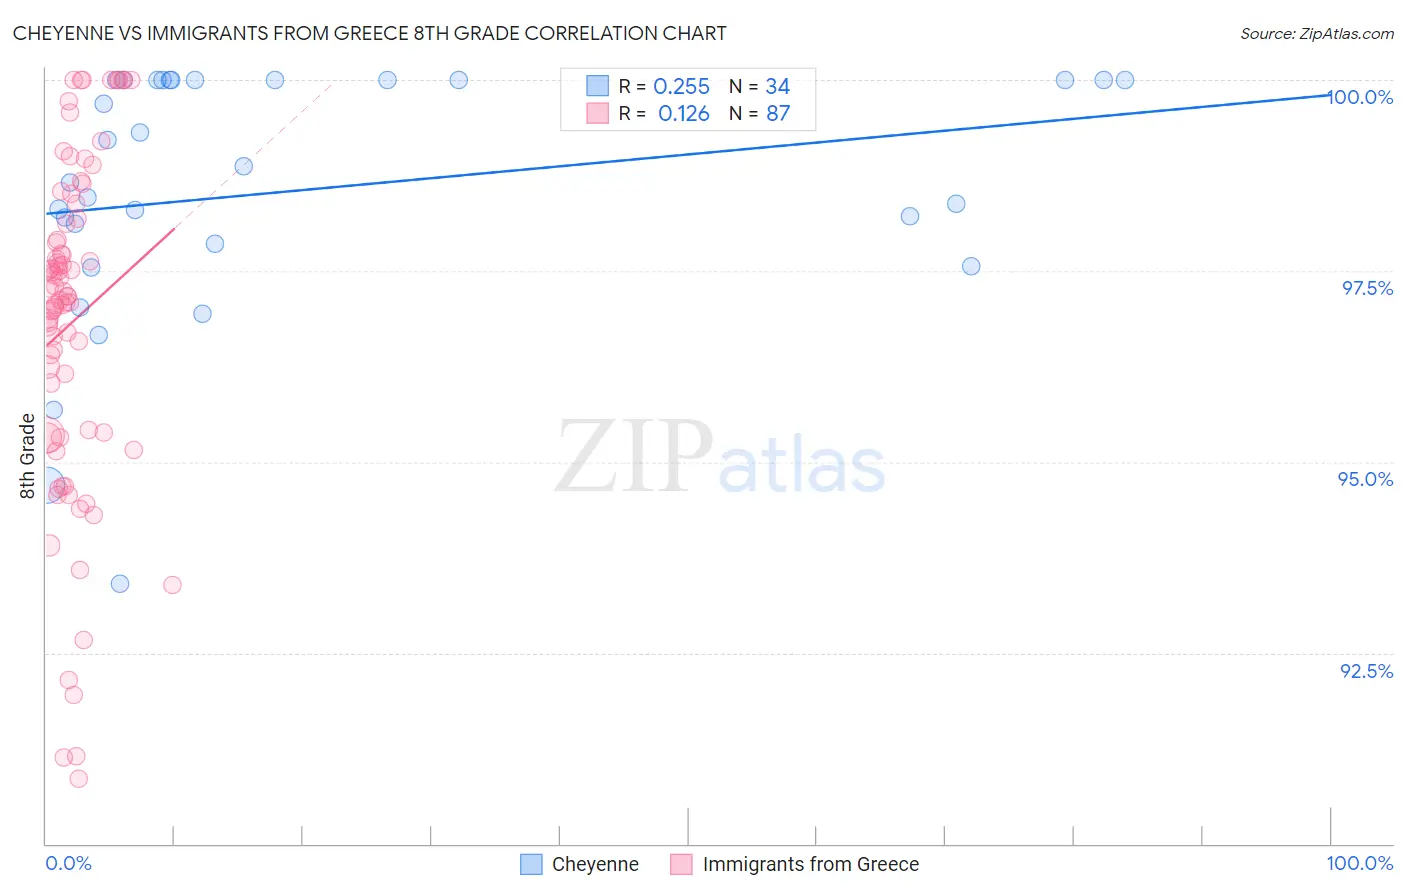
Cheyenne vs Immigrants from Greece 8th Grade Correlation Chart
The statistical analysis conducted on geographies consisting of 80,719,411 people shows a weak positive correlation between the proportion of Cheyenne and percentage of population with at least 8th grade education in the United States with a correlation coefficient (R) of 0.255 and weighted average of 96.1%. Similarly, the statistical analysis conducted on geographies consisting of 216,879,847 people shows a poor positive correlation between the proportion of Immigrants from Greece and percentage of population with at least 8th grade education in the United States with a correlation coefficient (R) of 0.126 and weighted average of 96.0%, a difference of 0.13%.
8th Grade Correlation Summary
| Measurement | Cheyenne | Immigrants from Greece |
| Minimum | 93.4% | 90.9% |
| Maximum | 100.0% | 100.0% |
| Range | 6.6% | 9.1% |
| Mean | 98.6% | 96.8% |
| Median | 98.8% | 97.2% |
| Interquartile 25% (IQ1) | 97.8% | 95.4% |
| Interquartile 75% (IQ3) | 100.0% | 98.2% |
| Interquartile Range (IQR) | 2.2% | 2.8% |
| Standard Deviation (Sample) | 1.7% | 2.2% |
| Standard Deviation (Population) | 1.6% | 2.2% |
Demographics Similar to Cheyenne and Immigrants from Greece by 8th Grade
In terms of 8th grade, the demographic groups most similar to Cheyenne are Immigrants from Bosnia and Herzegovina (96.2%, a difference of 0.010%), Immigrants from Romania (96.2%, a difference of 0.020%), Choctaw (96.2%, a difference of 0.020%), Immigrants from Serbia (96.2%, a difference of 0.020%), and Soviet Union (96.1%, a difference of 0.020%). Similarly, the demographic groups most similar to Immigrants from Greece are Immigrants from Eastern Europe (96.0%, a difference of 0.010%), Spanish (96.0%, a difference of 0.010%), Immigrants from Belarus (96.0%, a difference of 0.010%), Lumbee (96.0%, a difference of 0.020%), and Immigrants from South Central Asia (96.1%, a difference of 0.050%).
| Demographics | Rating | Rank | 8th Grade |
| Immigrants | Romania | 94.1 /100 | #125 | Exceptional 96.2% |
| Choctaw | 94.0 /100 | #126 | Exceptional 96.2% |
| Immigrants | Serbia | 94.0 /100 | #127 | Exceptional 96.2% |
| Immigrants | Bosnia and Herzegovina | 93.9 /100 | #128 | Exceptional 96.2% |
| Cheyenne | 93.3 /100 | #129 | Exceptional 96.1% |
| Soviet Union | 92.6 /100 | #130 | Exceptional 96.1% |
| Pueblo | 92.3 /100 | #131 | Exceptional 96.1% |
| Immigrants | Kuwait | 92.2 /100 | #132 | Exceptional 96.1% |
| Immigrants | Turkey | 91.7 /100 | #133 | Exceptional 96.1% |
| Immigrants | Hungary | 91.5 /100 | #134 | Exceptional 96.1% |
| Basques | 91.5 /100 | #135 | Exceptional 96.1% |
| Jordanians | 91.3 /100 | #136 | Exceptional 96.1% |
| Cambodians | 90.6 /100 | #137 | Exceptional 96.1% |
| Burmese | 90.2 /100 | #138 | Exceptional 96.1% |
| Hmong | 89.7 /100 | #139 | Excellent 96.1% |
| Immigrants | South Central Asia | 89.4 /100 | #140 | Excellent 96.1% |
| Immigrants | Greece | 85.9 /100 | #141 | Excellent 96.0% |
| Immigrants | Eastern Europe | 85.4 /100 | #142 | Excellent 96.0% |
| Spanish | 85.1 /100 | #143 | Excellent 96.0% |
| Immigrants | Belarus | 84.8 /100 | #144 | Excellent 96.0% |
| Lumbee | 84.1 /100 | #145 | Excellent 96.0% |