Central American Indian vs Immigrants from Bosnia and Herzegovina Unemployment Among Ages 45 to 54 years
COMPARE
Central American Indian
Immigrants from Bosnia and Herzegovina
Unemployment Among Ages 45 to 54 years
Unemployment Among Ages 45 to 54 years Comparison
Central American Indians
Immigrants from Bosnia and Herzegovina
5.3%
UNEMPLOYMENT AMONG AGES 45 TO 54 YEARS
0.0/ 100
METRIC RATING
300th/ 347
METRIC RANK
4.0%
UNEMPLOYMENT AMONG AGES 45 TO 54 YEARS
100.0/ 100
METRIC RATING
14th/ 347
METRIC RANK
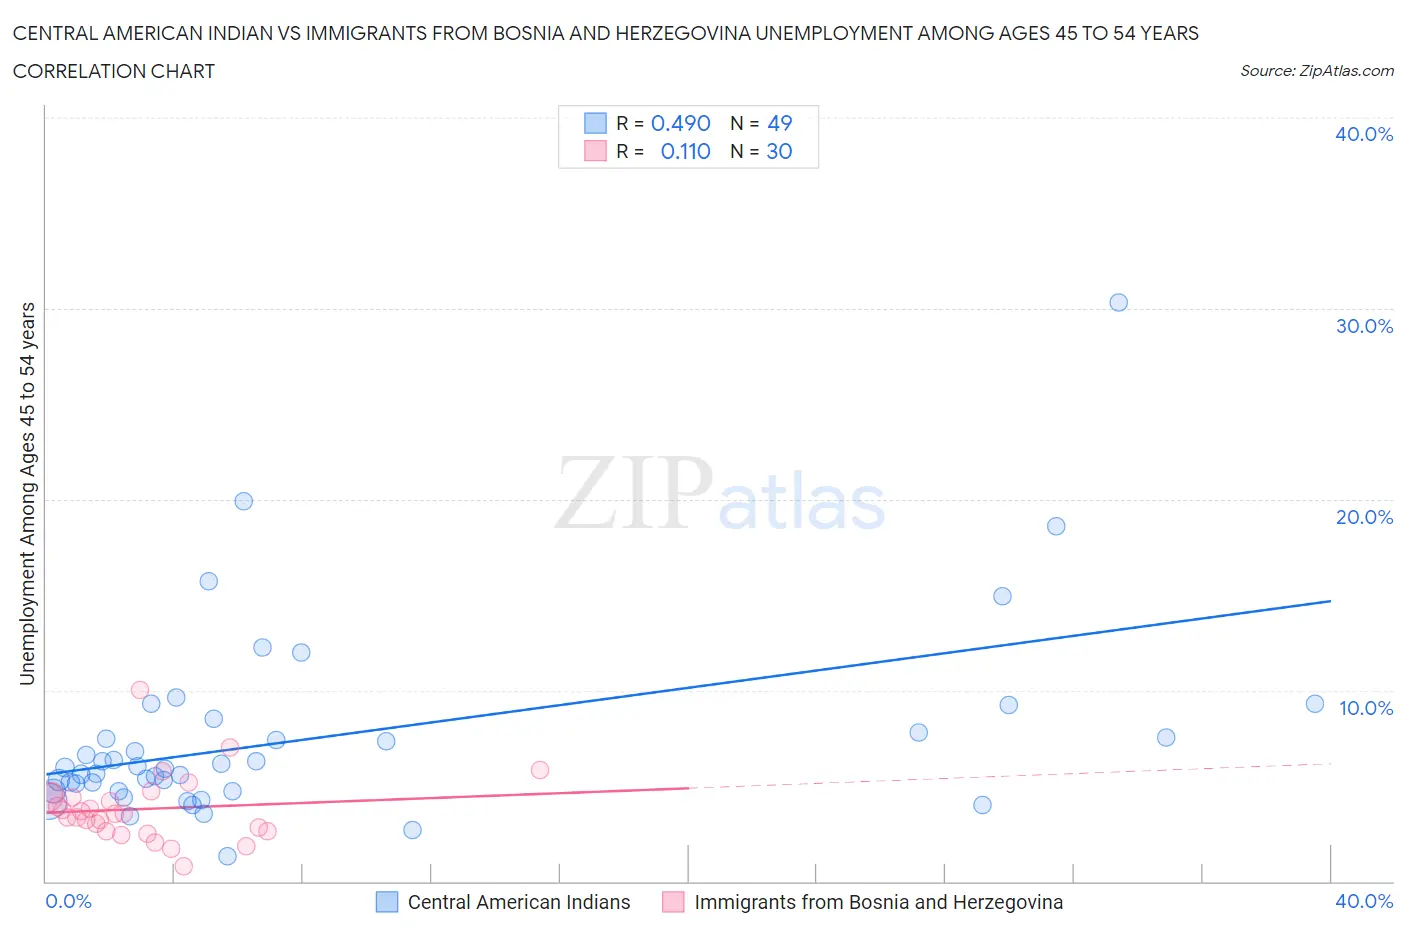
Central American Indian vs Immigrants from Bosnia and Herzegovina Unemployment Among Ages 45 to 54 years Correlation Chart
The statistical analysis conducted on geographies consisting of 321,467,367 people shows a moderate positive correlation between the proportion of Central American Indians and unemployment rate among population between the ages 45 and 54 in the United States with a correlation coefficient (R) of 0.490 and weighted average of 5.3%. Similarly, the statistical analysis conducted on geographies consisting of 155,024,454 people shows a poor positive correlation between the proportion of Immigrants from Bosnia and Herzegovina and unemployment rate among population between the ages 45 and 54 in the United States with a correlation coefficient (R) of 0.110 and weighted average of 4.0%, a difference of 31.8%.
Unemployment Among Ages 45 to 54 years Correlation Summary
| Measurement | Central American Indian | Immigrants from Bosnia and Herzegovina |
| Minimum | 1.3% | 0.80% |
| Maximum | 30.3% | 10.0% |
| Range | 29.0% | 9.2% |
| Mean | 7.5% | 3.8% |
| Median | 5.9% | 3.5% |
| Interquartile 25% (IQ1) | 4.7% | 2.6% |
| Interquartile 75% (IQ3) | 8.2% | 4.4% |
| Interquartile Range (IQR) | 3.4% | 1.8% |
| Standard Deviation (Sample) | 5.0% | 1.8% |
| Standard Deviation (Population) | 5.0% | 1.7% |
Similar Demographics by Unemployment Among Ages 45 to 54 years
Demographics Similar to Central American Indians by Unemployment Among Ages 45 to 54 years
In terms of unemployment among ages 45 to 54 years, the demographic groups most similar to Central American Indians are Ecuadorian (5.3%, a difference of 0.21%), Menominee (5.3%, a difference of 0.21%), Immigrants from Trinidad and Tobago (5.3%, a difference of 0.23%), Aleut (5.3%, a difference of 0.35%), and West Indian (5.3%, a difference of 0.35%).
| Demographics | Rating | Rank | Unemployment Among Ages 45 to 54 years |
| Immigrants | Senegal | 0.0 /100 | #293 | Tragic 5.2% |
| Belizeans | 0.0 /100 | #294 | Tragic 5.2% |
| Jamaicans | 0.0 /100 | #295 | Tragic 5.3% |
| Aleuts | 0.0 /100 | #296 | Tragic 5.3% |
| West Indians | 0.0 /100 | #297 | Tragic 5.3% |
| Immigrants | Trinidad and Tobago | 0.0 /100 | #298 | Tragic 5.3% |
| Ecuadorians | 0.0 /100 | #299 | Tragic 5.3% |
| Central American Indians | 0.0 /100 | #300 | Tragic 5.3% |
| Menominee | 0.0 /100 | #301 | Tragic 5.3% |
| Immigrants | Ecuador | 0.0 /100 | #302 | Tragic 5.3% |
| Immigrants | Belize | 0.0 /100 | #303 | Tragic 5.3% |
| Immigrants | Jamaica | 0.0 /100 | #304 | Tragic 5.4% |
| Immigrants | West Indies | 0.0 /100 | #305 | Tragic 5.4% |
| Immigrants | Bangladesh | 0.0 /100 | #306 | Tragic 5.4% |
| Vietnamese | 0.0 /100 | #307 | Tragic 5.4% |
Demographics Similar to Immigrants from Bosnia and Herzegovina by Unemployment Among Ages 45 to 54 years
In terms of unemployment among ages 45 to 54 years, the demographic groups most similar to Immigrants from Bosnia and Herzegovina are Cuban (4.0%, a difference of 0.050%), Swedish (4.0%, a difference of 0.20%), Scandinavian (4.0%, a difference of 0.21%), Venezuelan (4.0%, a difference of 0.35%), and Immigrants from Bolivia (4.0%, a difference of 0.43%).
| Demographics | Rating | Rank | Unemployment Among Ages 45 to 54 years |
| Immigrants | Venezuela | 100.0 /100 | #7 | Exceptional 3.9% |
| Chinese | 100.0 /100 | #8 | Exceptional 4.0% |
| Czechs | 100.0 /100 | #9 | Exceptional 4.0% |
| Venezuelans | 100.0 /100 | #10 | Exceptional 4.0% |
| Scandinavians | 100.0 /100 | #11 | Exceptional 4.0% |
| Swedes | 100.0 /100 | #12 | Exceptional 4.0% |
| Cubans | 100.0 /100 | #13 | Exceptional 4.0% |
| Immigrants | Bosnia and Herzegovina | 100.0 /100 | #14 | Exceptional 4.0% |
| Immigrants | Bolivia | 100.0 /100 | #15 | Exceptional 4.0% |
| Thais | 100.0 /100 | #16 | Exceptional 4.0% |
| Tongans | 100.0 /100 | #17 | Exceptional 4.1% |
| Germans | 100.0 /100 | #18 | Exceptional 4.1% |
| Swiss | 100.0 /100 | #19 | Exceptional 4.1% |
| English | 100.0 /100 | #20 | Exceptional 4.1% |
| Europeans | 100.0 /100 | #21 | Exceptional 4.1% |