Immigrants from Cameroon vs Spanish American Indian Female Poverty Among 18-24 Year Olds
COMPARE
Immigrants from Cameroon
Spanish American Indian
Female Poverty Among 18-24 Year Olds
Female Poverty Among 18-24 Year Olds Comparison
Immigrants from Cameroon
Spanish American Indians
19.3%
FEMALE POVERTY AMONG 18-24 YEAR OLDS
96.3/ 100
METRIC RATING
113th/ 347
METRIC RANK
18.1%
FEMALE POVERTY AMONG 18-24 YEAR OLDS
100.0/ 100
METRIC RATING
45th/ 347
METRIC RANK
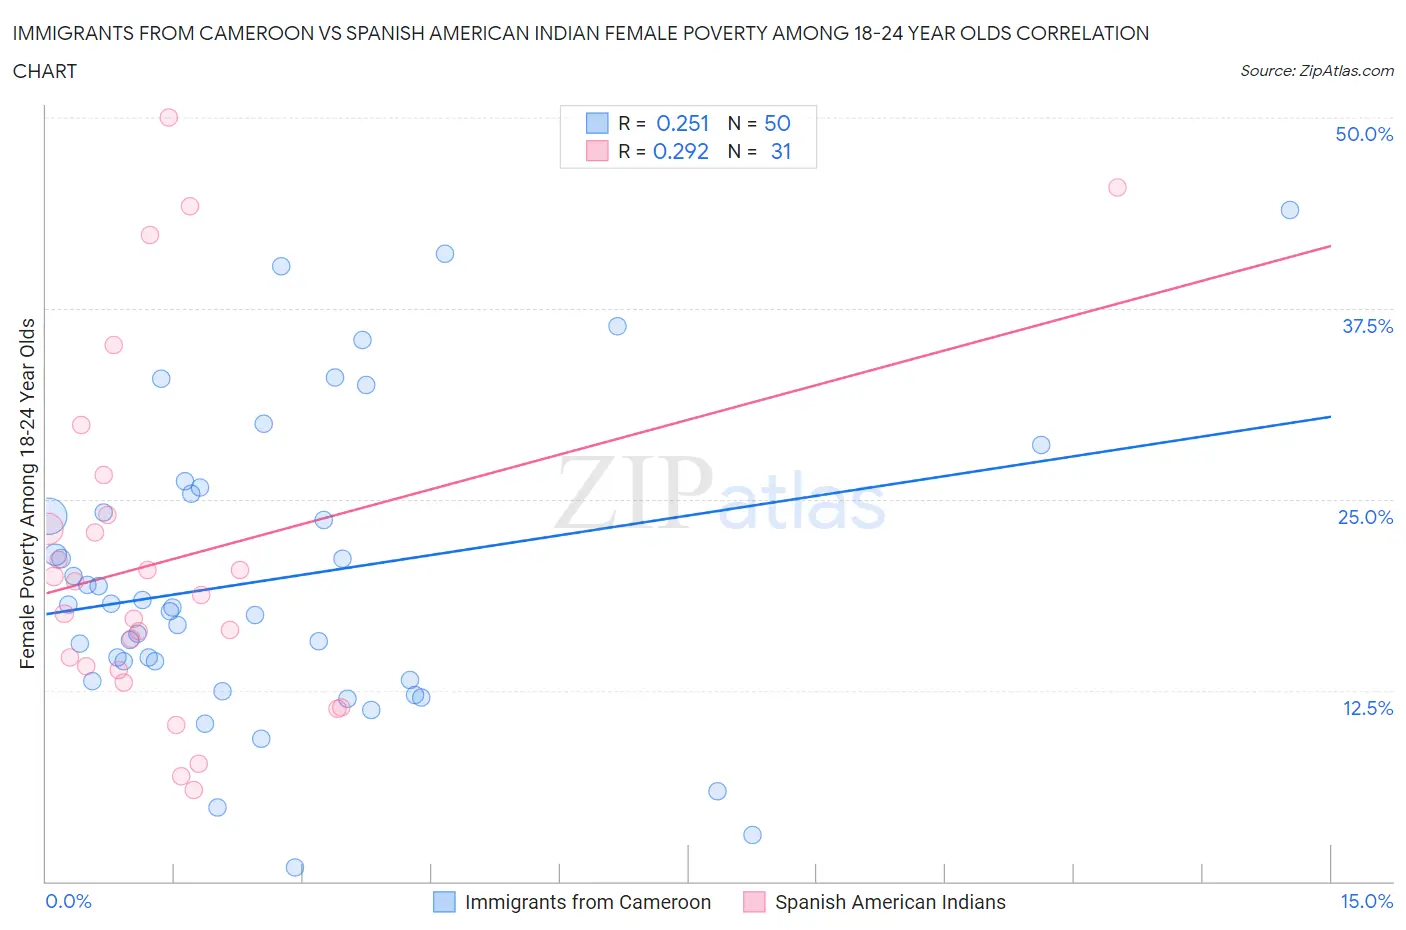
Immigrants from Cameroon vs Spanish American Indian Female Poverty Among 18-24 Year Olds Correlation Chart
The statistical analysis conducted on geographies consisting of 129,816,473 people shows a weak positive correlation between the proportion of Immigrants from Cameroon and poverty level among females between the ages 18 and 24 in the United States with a correlation coefficient (R) of 0.251 and weighted average of 19.3%. Similarly, the statistical analysis conducted on geographies consisting of 73,008,274 people shows a weak positive correlation between the proportion of Spanish American Indians and poverty level among females between the ages 18 and 24 in the United States with a correlation coefficient (R) of 0.292 and weighted average of 18.1%, a difference of 6.5%.
Female Poverty Among 18-24 Year Olds Correlation Summary
| Measurement | Immigrants from Cameroon | Spanish American Indian |
| Minimum | 0.87% | 6.0% |
| Maximum | 43.9% | 50.0% |
| Range | 43.1% | 44.0% |
| Mean | 19.8% | 21.2% |
| Median | 18.0% | 18.8% |
| Interquartile 25% (IQ1) | 13.2% | 13.8% |
| Interquartile 75% (IQ3) | 25.4% | 24.0% |
| Interquartile Range (IQR) | 12.2% | 10.1% |
| Standard Deviation (Sample) | 9.8% | 11.5% |
| Standard Deviation (Population) | 9.7% | 11.3% |
Similar Demographics by Female Poverty Among 18-24 Year Olds
Demographics Similar to Immigrants from Cameroon by Female Poverty Among 18-24 Year Olds
In terms of female poverty among 18-24 year olds, the demographic groups most similar to Immigrants from Cameroon are Slovene (19.3%, a difference of 0.040%), Immigrants from Hungary (19.3%, a difference of 0.050%), Immigrants from El Salvador (19.3%, a difference of 0.060%), Immigrants (19.3%, a difference of 0.15%), and Immigrants from Iran (19.3%, a difference of 0.19%).
| Demographics | Rating | Rank | Female Poverty Among 18-24 Year Olds |
| Immigrants | Sierra Leone | 97.8 /100 | #106 | Exceptional 19.2% |
| Immigrants | Sri Lanka | 97.5 /100 | #107 | Exceptional 19.2% |
| Immigrants | Uzbekistan | 97.3 /100 | #108 | Exceptional 19.2% |
| Immigrants | Syria | 97.2 /100 | #109 | Exceptional 19.2% |
| Laotians | 97.1 /100 | #110 | Exceptional 19.2% |
| Immigrants | Serbia | 97.1 /100 | #111 | Exceptional 19.2% |
| Immigrants | El Salvador | 96.5 /100 | #112 | Exceptional 19.3% |
| Immigrants | Cameroon | 96.3 /100 | #113 | Exceptional 19.3% |
| Slovenes | 96.2 /100 | #114 | Exceptional 19.3% |
| Immigrants | Hungary | 96.2 /100 | #115 | Exceptional 19.3% |
| Immigrants | Immigrants | 95.9 /100 | #116 | Exceptional 19.3% |
| Immigrants | Iran | 95.8 /100 | #117 | Exceptional 19.3% |
| Immigrants | Guyana | 95.6 /100 | #118 | Exceptional 19.3% |
| Cypriots | 95.5 /100 | #119 | Exceptional 19.3% |
| Immigrants | Northern Europe | 95.4 /100 | #120 | Exceptional 19.4% |
Demographics Similar to Spanish American Indians by Female Poverty Among 18-24 Year Olds
In terms of female poverty among 18-24 year olds, the demographic groups most similar to Spanish American Indians are Nicaraguan (18.1%, a difference of 0.090%), Macedonian (18.1%, a difference of 0.17%), Bulgarian (18.1%, a difference of 0.18%), Immigrants from Southern Europe (18.2%, a difference of 0.28%), and Asian (18.2%, a difference of 0.37%).
| Demographics | Rating | Rank | Female Poverty Among 18-24 Year Olds |
| South Americans | 100.0 /100 | #38 | Exceptional 18.0% |
| Puget Sound Salish | 100.0 /100 | #39 | Exceptional 18.0% |
| Immigrants | Romania | 100.0 /100 | #40 | Exceptional 18.0% |
| Immigrants | Argentina | 100.0 /100 | #41 | Exceptional 18.0% |
| Bulgarians | 100.0 /100 | #42 | Exceptional 18.1% |
| Macedonians | 100.0 /100 | #43 | Exceptional 18.1% |
| Nicaraguans | 100.0 /100 | #44 | Exceptional 18.1% |
| Spanish American Indians | 100.0 /100 | #45 | Exceptional 18.1% |
| Immigrants | Southern Europe | 100.0 /100 | #46 | Exceptional 18.2% |
| Asians | 100.0 /100 | #47 | Exceptional 18.2% |
| Sri Lankans | 100.0 /100 | #48 | Exceptional 18.2% |
| Bhutanese | 100.0 /100 | #49 | Exceptional 18.2% |
| Samoans | 100.0 /100 | #50 | Exceptional 18.2% |
| Immigrants | Eastern Europe | 99.9 /100 | #51 | Exceptional 18.2% |
| Immigrants | Ireland | 99.9 /100 | #52 | Exceptional 18.3% |