Cajun vs Immigrants from Croatia Currently Married
COMPARE
Cajun
Immigrants from Croatia
Currently Married
Currently Married Comparison
Cajuns
Immigrants from Croatia
47.1%
CURRENTLY MARRIED
75.3/ 100
METRIC RATING
140th/ 347
METRIC RANK
47.5%
CURRENTLY MARRIED
88.6/ 100
METRIC RATING
121st/ 347
METRIC RANK
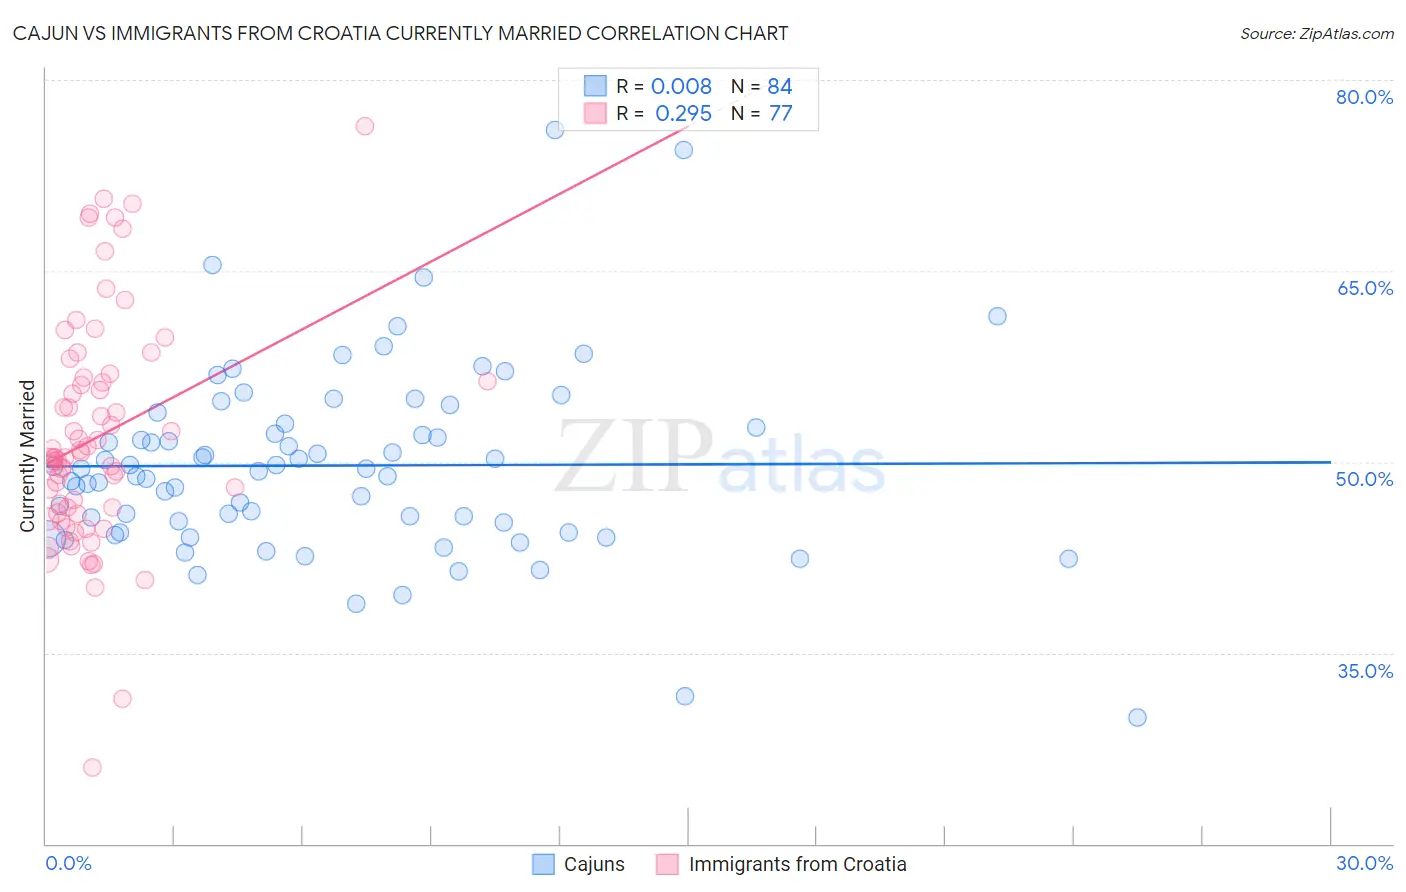
Cajun vs Immigrants from Croatia Currently Married Correlation Chart
The statistical analysis conducted on geographies consisting of 149,704,790 people shows no correlation between the proportion of Cajuns and percentage of population currently married in the United States with a correlation coefficient (R) of 0.008 and weighted average of 47.1%. Similarly, the statistical analysis conducted on geographies consisting of 132,574,468 people shows a weak positive correlation between the proportion of Immigrants from Croatia and percentage of population currently married in the United States with a correlation coefficient (R) of 0.295 and weighted average of 47.5%, a difference of 0.85%.
Currently Married Correlation Summary
| Measurement | Cajun | Immigrants from Croatia |
| Minimum | 29.9% | 26.0% |
| Maximum | 76.1% | 76.4% |
| Range | 46.2% | 50.4% |
| Mean | 49.7% | 51.9% |
| Median | 49.4% | 50.4% |
| Interquartile 25% (IQ1) | 44.9% | 45.9% |
| Interquartile 75% (IQ3) | 52.9% | 56.5% |
| Interquartile Range (IQR) | 8.0% | 10.5% |
| Standard Deviation (Sample) | 7.5% | 9.0% |
| Standard Deviation (Population) | 7.4% | 8.9% |
Demographics Similar to Cajuns and Immigrants from Croatia by Currently Married
In terms of currently married, the demographic groups most similar to Cajuns are Pakistani (47.2%, a difference of 0.11%), Yugoslavian (47.2%, a difference of 0.11%), Paraguayan (47.2%, a difference of 0.13%), Immigrants from Vietnam (47.2%, a difference of 0.15%), and Immigrants from Norway (47.2%, a difference of 0.23%). Similarly, the demographic groups most similar to Immigrants from Croatia are Syrian (47.5%, a difference of 0.030%), Osage (47.5%, a difference of 0.060%), Immigrants from Kazakhstan (47.4%, a difference of 0.12%), Laotian (47.4%, a difference of 0.17%), and Okinawan (47.4%, a difference of 0.26%).
| Demographics | Rating | Rank | Currently Married |
| Syrians | 88.9 /100 | #120 | Excellent 47.5% |
| Immigrants | Croatia | 88.6 /100 | #121 | Excellent 47.5% |
| Osage | 87.9 /100 | #122 | Excellent 47.5% |
| Immigrants | Kazakhstan | 87.2 /100 | #123 | Excellent 47.4% |
| Laotians | 86.6 /100 | #124 | Excellent 47.4% |
| Okinawans | 85.3 /100 | #125 | Excellent 47.4% |
| Immigrants | Jordan | 84.9 /100 | #126 | Excellent 47.4% |
| New Zealanders | 84.9 /100 | #127 | Excellent 47.4% |
| Portuguese | 84.2 /100 | #128 | Excellent 47.3% |
| Sri Lankans | 83.2 /100 | #129 | Excellent 47.3% |
| Immigrants | Iraq | 82.8 /100 | #130 | Excellent 47.3% |
| Icelanders | 82.4 /100 | #131 | Excellent 47.3% |
| Afghans | 81.8 /100 | #132 | Excellent 47.3% |
| Immigrants | Malaysia | 81.1 /100 | #133 | Excellent 47.3% |
| Immigrants | Australia | 81.1 /100 | #134 | Excellent 47.3% |
| Immigrants | Norway | 79.7 /100 | #135 | Good 47.2% |
| Immigrants | Vietnam | 78.2 /100 | #136 | Good 47.2% |
| Paraguayans | 77.8 /100 | #137 | Good 47.2% |
| Pakistanis | 77.5 /100 | #138 | Good 47.2% |
| Yugoslavians | 77.4 /100 | #139 | Good 47.2% |
| Cajuns | 75.3 /100 | #140 | Good 47.1% |