Cajun vs Comanche Female Poverty Among 18-24 Year Olds
COMPARE
Cajun
Comanche
Female Poverty Among 18-24 Year Olds
Female Poverty Among 18-24 Year Olds Comparison
Cajuns
Comanche
25.7%
FEMALE POVERTY AMONG 18-24 YEAR OLDS
0.0/ 100
METRIC RATING
329th/ 347
METRIC RANK
23.6%
FEMALE POVERTY AMONG 18-24 YEAR OLDS
0.0/ 100
METRIC RATING
310th/ 347
METRIC RANK
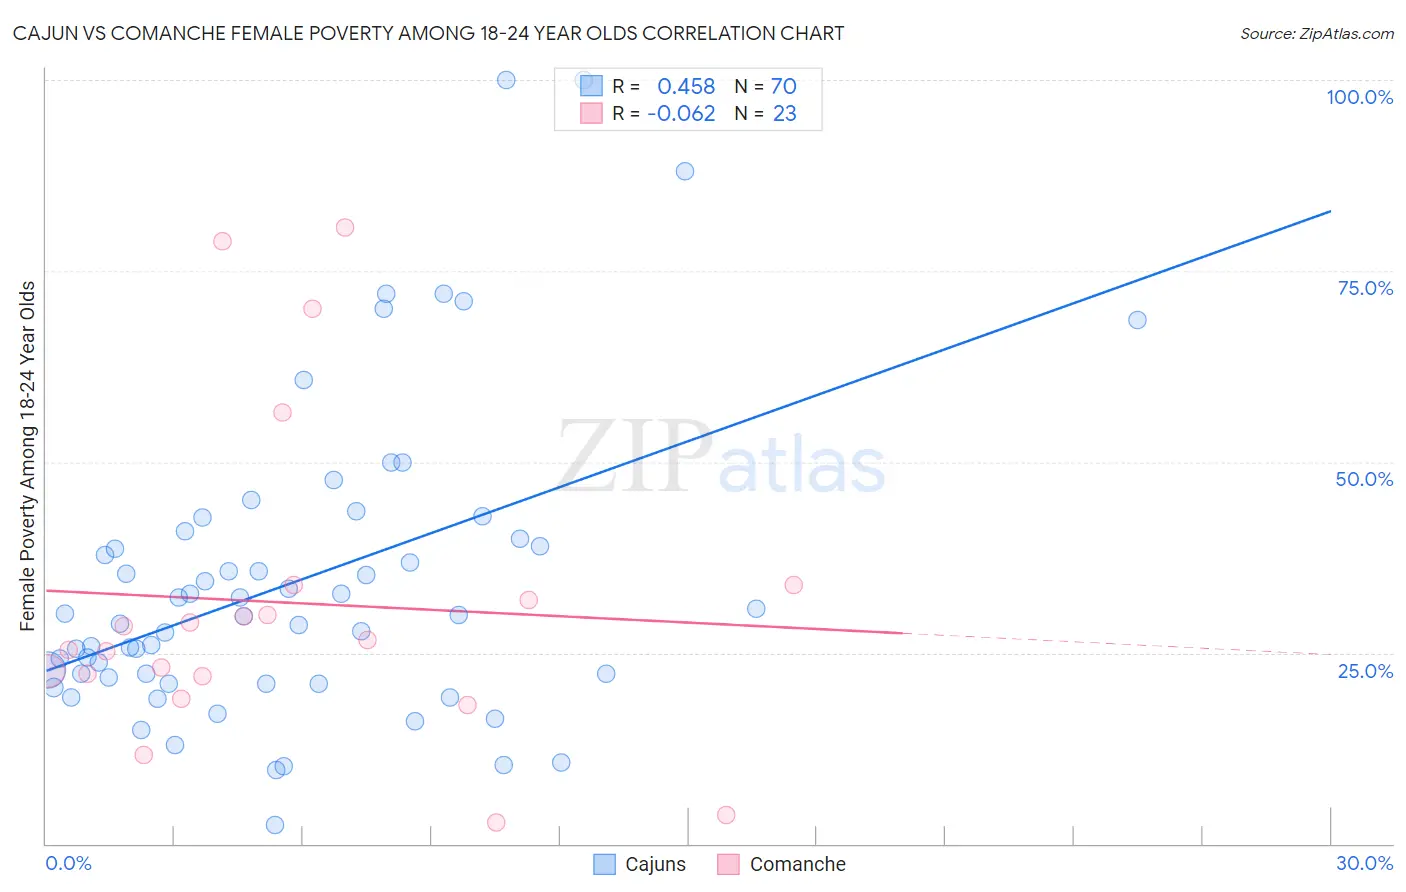
Cajun vs Comanche Female Poverty Among 18-24 Year Olds Correlation Chart
The statistical analysis conducted on geographies consisting of 148,140,723 people shows a moderate positive correlation between the proportion of Cajuns and poverty level among females between the ages 18 and 24 in the United States with a correlation coefficient (R) of 0.458 and weighted average of 25.7%. Similarly, the statistical analysis conducted on geographies consisting of 109,070,377 people shows a slight negative correlation between the proportion of Comanche and poverty level among females between the ages 18 and 24 in the United States with a correlation coefficient (R) of -0.062 and weighted average of 23.6%, a difference of 8.8%.
Female Poverty Among 18-24 Year Olds Correlation Summary
| Measurement | Cajun | Comanche |
| Minimum | 2.4% | 2.9% |
| Maximum | 100.0% | 80.7% |
| Range | 97.6% | 77.8% |
| Mean | 34.3% | 31.5% |
| Median | 29.9% | 26.7% |
| Interquartile 25% (IQ1) | 21.7% | 21.9% |
| Interquartile 75% (IQ3) | 40.0% | 33.9% |
| Interquartile Range (IQR) | 18.3% | 12.0% |
| Standard Deviation (Sample) | 20.2% | 20.8% |
| Standard Deviation (Population) | 20.1% | 20.4% |
Demographics Similar to Cajuns and Comanche by Female Poverty Among 18-24 Year Olds
In terms of female poverty among 18-24 year olds, the demographic groups most similar to Cajuns are Native/Alaskan (25.4%, a difference of 1.1%), Ute (25.4%, a difference of 1.1%), Yakama (25.3%, a difference of 1.4%), Immigrants from Saudi Arabia (25.3%, a difference of 1.6%), and German Russian (25.2%, a difference of 2.1%). Similarly, the demographic groups most similar to Comanche are Blackfeet (23.6%, a difference of 0.050%), Potawatomi (23.7%, a difference of 0.29%), Yuman (24.0%, a difference of 1.5%), Creek (24.2%, a difference of 2.5%), and Choctaw (24.3%, a difference of 2.7%).
| Demographics | Rating | Rank | Female Poverty Among 18-24 Year Olds |
| Blackfeet | 0.0 /100 | #309 | Tragic 23.6% |
| Comanche | 0.0 /100 | #310 | Tragic 23.6% |
| Potawatomi | 0.0 /100 | #311 | Tragic 23.7% |
| Yuman | 0.0 /100 | #312 | Tragic 24.0% |
| Creek | 0.0 /100 | #313 | Tragic 24.2% |
| Choctaw | 0.0 /100 | #314 | Tragic 24.3% |
| Blacks/African Americans | 0.0 /100 | #315 | Tragic 24.3% |
| Alsatians | 0.0 /100 | #316 | Tragic 24.4% |
| Osage | 0.0 /100 | #317 | Tragic 24.5% |
| Chickasaw | 0.0 /100 | #318 | Tragic 24.5% |
| Dutch West Indians | 0.0 /100 | #319 | Tragic 24.5% |
| Immigrants | Congo | 0.0 /100 | #320 | Tragic 24.6% |
| Immigrants | Zaire | 0.0 /100 | #321 | Tragic 25.1% |
| Somalis | 0.0 /100 | #322 | Tragic 25.1% |
| Arapaho | 0.0 /100 | #323 | Tragic 25.2% |
| German Russians | 0.0 /100 | #324 | Tragic 25.2% |
| Immigrants | Saudi Arabia | 0.0 /100 | #325 | Tragic 25.3% |
| Yakama | 0.0 /100 | #326 | Tragic 25.3% |
| Ute | 0.0 /100 | #327 | Tragic 25.4% |
| Natives/Alaskans | 0.0 /100 | #328 | Tragic 25.4% |
| Cajuns | 0.0 /100 | #329 | Tragic 25.7% |