Immigrants from Kazakhstan vs Comanche Female Poverty Among 18-24 Year Olds
COMPARE
Immigrants from Kazakhstan
Comanche
Female Poverty Among 18-24 Year Olds
Female Poverty Among 18-24 Year Olds Comparison
Immigrants from Kazakhstan
Comanche
20.2%
FEMALE POVERTY AMONG 18-24 YEAR OLDS
44.2/ 100
METRIC RATING
177th/ 347
METRIC RANK
23.6%
FEMALE POVERTY AMONG 18-24 YEAR OLDS
0.0/ 100
METRIC RATING
310th/ 347
METRIC RANK
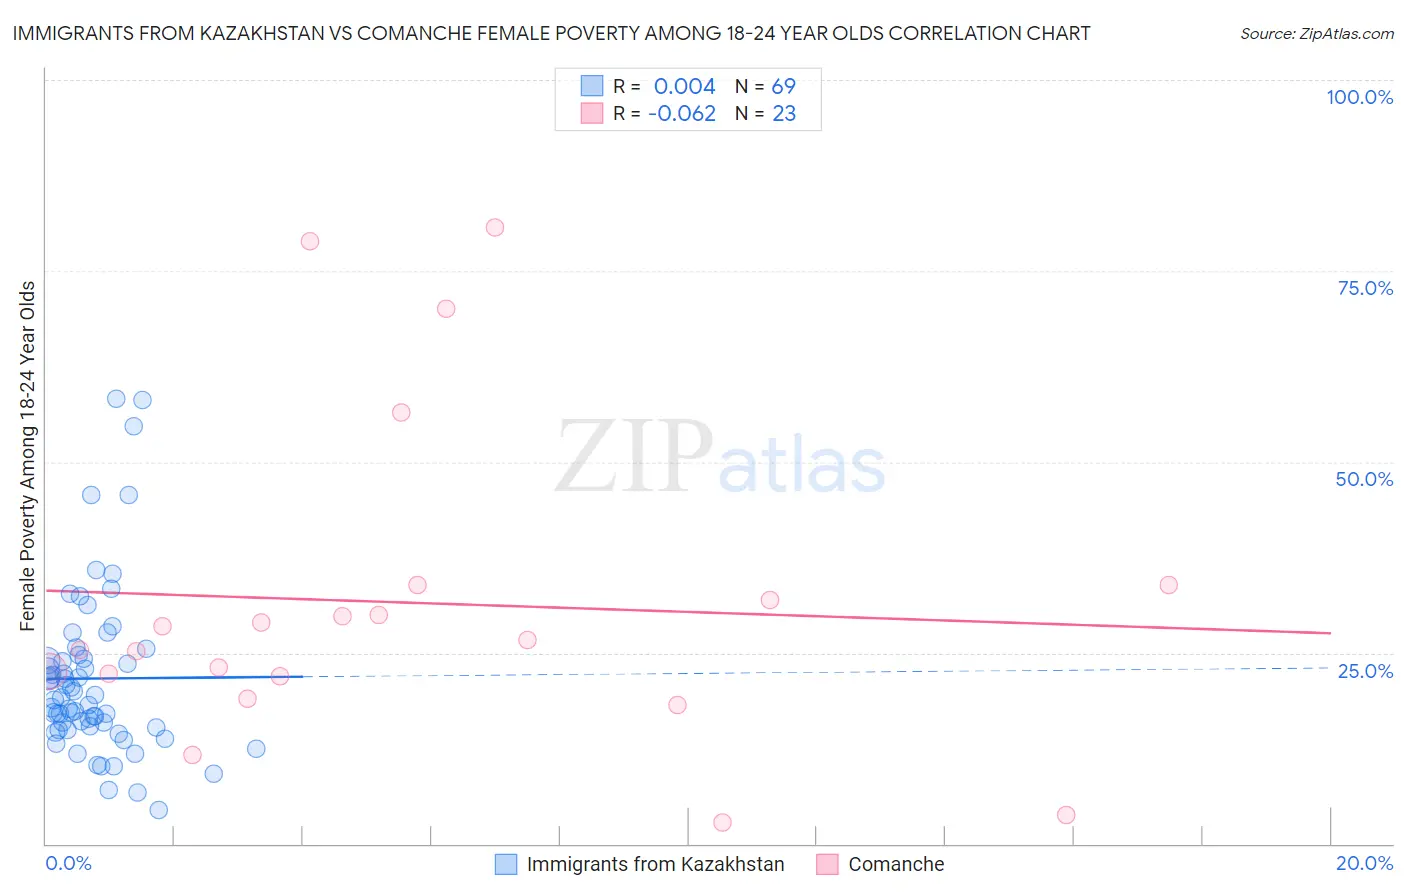
Immigrants from Kazakhstan vs Comanche Female Poverty Among 18-24 Year Olds Correlation Chart
The statistical analysis conducted on geographies consisting of 123,639,864 people shows no correlation between the proportion of Immigrants from Kazakhstan and poverty level among females between the ages 18 and 24 in the United States with a correlation coefficient (R) of 0.004 and weighted average of 20.2%. Similarly, the statistical analysis conducted on geographies consisting of 109,070,377 people shows a slight negative correlation between the proportion of Comanche and poverty level among females between the ages 18 and 24 in the United States with a correlation coefficient (R) of -0.062 and weighted average of 23.6%, a difference of 17.2%.
Female Poverty Among 18-24 Year Olds Correlation Summary
| Measurement | Immigrants from Kazakhstan | Comanche |
| Minimum | 4.3% | 2.9% |
| Maximum | 58.3% | 80.7% |
| Range | 54.0% | 77.8% |
| Mean | 21.6% | 31.5% |
| Median | 18.9% | 26.7% |
| Interquartile 25% (IQ1) | 15.1% | 21.9% |
| Interquartile 75% (IQ3) | 24.5% | 33.9% |
| Interquartile Range (IQR) | 9.4% | 12.0% |
| Standard Deviation (Sample) | 11.1% | 20.8% |
| Standard Deviation (Population) | 11.0% | 20.4% |
Similar Demographics by Female Poverty Among 18-24 Year Olds
Demographics Similar to Immigrants from Kazakhstan by Female Poverty Among 18-24 Year Olds
In terms of female poverty among 18-24 year olds, the demographic groups most similar to Immigrants from Kazakhstan are Swiss (20.2%, a difference of 0.010%), Ethiopian (20.2%, a difference of 0.020%), Kenyan (20.2%, a difference of 0.040%), Iraqi (20.2%, a difference of 0.040%), and Immigrants from China (20.2%, a difference of 0.060%).
| Demographics | Rating | Rank | Female Poverty Among 18-24 Year Olds |
| Iranians | 54.7 /100 | #170 | Average 20.1% |
| Immigrants | Nigeria | 54.3 /100 | #171 | Average 20.1% |
| Belizeans | 52.0 /100 | #172 | Average 20.1% |
| Irish | 50.0 /100 | #173 | Average 20.1% |
| Swedes | 50.0 /100 | #174 | Average 20.1% |
| South American Indians | 48.4 /100 | #175 | Average 20.1% |
| Kenyans | 44.9 /100 | #176 | Average 20.2% |
| Immigrants | Kazakhstan | 44.2 /100 | #177 | Average 20.2% |
| Swiss | 44.0 /100 | #178 | Average 20.2% |
| Ethiopians | 43.8 /100 | #179 | Average 20.2% |
| Iraqis | 43.3 /100 | #180 | Average 20.2% |
| Immigrants | China | 43.0 /100 | #181 | Average 20.2% |
| Immigrants | Barbados | 42.8 /100 | #182 | Average 20.2% |
| Lebanese | 40.6 /100 | #183 | Average 20.2% |
| Immigrants | Central America | 39.9 /100 | #184 | Fair 20.2% |
Demographics Similar to Comanche by Female Poverty Among 18-24 Year Olds
In terms of female poverty among 18-24 year olds, the demographic groups most similar to Comanche are Blackfeet (23.6%, a difference of 0.050%), Potawatomi (23.7%, a difference of 0.29%), Immigrants from Sudan (23.5%, a difference of 0.50%), Cree (23.4%, a difference of 0.85%), and Paiute (23.3%, a difference of 1.4%).
| Demographics | Rating | Rank | Female Poverty Among 18-24 Year Olds |
| Senegalese | 0.0 /100 | #303 | Tragic 23.0% |
| Sudanese | 0.0 /100 | #304 | Tragic 23.0% |
| Immigrants | Kuwait | 0.0 /100 | #305 | Tragic 23.0% |
| Paiute | 0.0 /100 | #306 | Tragic 23.3% |
| Cree | 0.0 /100 | #307 | Tragic 23.4% |
| Immigrants | Sudan | 0.0 /100 | #308 | Tragic 23.5% |
| Blackfeet | 0.0 /100 | #309 | Tragic 23.6% |
| Comanche | 0.0 /100 | #310 | Tragic 23.6% |
| Potawatomi | 0.0 /100 | #311 | Tragic 23.7% |
| Yuman | 0.0 /100 | #312 | Tragic 24.0% |
| Creek | 0.0 /100 | #313 | Tragic 24.2% |
| Choctaw | 0.0 /100 | #314 | Tragic 24.3% |
| Blacks/African Americans | 0.0 /100 | #315 | Tragic 24.3% |
| Alsatians | 0.0 /100 | #316 | Tragic 24.4% |
| Osage | 0.0 /100 | #317 | Tragic 24.5% |