Burmese vs Immigrants from Austria Child Poverty Under the Age of 5

COMPARE

Burmese
Race
Ancestry
AfghanAfricanAlaska NativeAlaskan AthabascanAlbanianAleutAlsatianAmericanApacheArabArapahoArgentineanArmenianAssyrian/Chaldean/SyriacAustralianAustrianBahamianBangladeshiBarbadianBasqueBelgianBelizeanBermudanBhutaneseBlackfeetBolivianBrazilianBritishBritish West IndianBulgarianBurmeseCajunCambodianCanadianCape VerdeanCarpatho RusynCelticCentral AmericanCentral American IndianCherokeeCheyenneChickasawChileanChineseChippewaChoctawColombianColvilleComancheCosta RicanCreeCreekCroatianCrowCubanCypriotCzechCzechoslovakianDanishDelawareDominicanDutchDutch West IndianEastern EuropeanEcuadorianEgyptianEnglishEstonianEthiopianEuropeanFijianFilipinoFinnishFrenchFrench American IndianFrench CanadianGermanGerman RussianGhanaianGreekGuamanian/ChamorroGuatemalanGuyaneseHaitianHmongHonduranHopiHoumaHungarianIcelanderIndian (Asian)IndonesianInupiatIranianIraqiIrishIroquoisIsraeliItalianJamaicanJapaneseJordanianKenyanKiowaKoreanLaotianLatvianLebaneseLiberianLithuanianLumbeeLuxembourgerMacedonianMalaysianMalteseMarshalleseMenomineeMexicanMexican American IndianMongolianMoroccanNative HawaiianNavajoNepaleseNew ZealanderNicaraguanNigerianNorthern EuropeanNorwegianOkinawanOsageOttawaPaiutePakistaniPalestinianPanamanianParaguayanPennsylvania GermanPeruvianPimaPolishPortuguesePotawatomiPuebloPuerto RicanPuget Sound SalishRomanianRussianSalvadoranSamoanScandinavianScotch-IrishScottishSeminoleSenegaleseSerbianShoshoneSierra LeoneanSiouxSlavicSlovakSloveneSomaliSouth AfricanSouth AmericanSouth American IndianSoviet UnionSpaniardSpanishSpanish AmericanSpanish American IndianSri LankanSubsaharan AfricanSudaneseSwedishSwissSyrianTaiwaneseThaiTlingit-HaidaTohono O'OdhamTonganTrinidadian and TobagonianTsimshianTurkishU.S. Virgin IslanderUgandanUkrainianUruguayanUteVenezuelanVietnameseWelshWest IndianYakamaYaquiYugoslavianYumanYup'ikZimbabwean
Immigration
NonimmigrantsImmigrantsAfghanistanAfricaAlbaniaArgentinaArmeniaAsiaAustraliaBahamasBangladeshBarbadosBelarusBelgiumBelizeBoliviaBosnia and HerzegovinaBrazilBulgariaBurma/MyanmarCabo VerdeCambodiaCameroonCanadaCaribbeanCentral AmericaChileChinaColombiaCongoCosta RicaCroatiaCubaCzechoslovakiaDenmarkDominicaDominican RepublicEastern AfricaEastern AsiaEastern EuropeEcuadorEgyptEl SalvadorEnglandEritreaEthiopiaEuropeFijiFranceGermanyGhanaGreeceGrenadaGuatemalaGuyanaHaitiHondurasHong KongHungaryIndiaIndonesiaIranIraqIrelandIsraelItalyJamaicaJapanJordanKazakhstanKenyaKoreaKuwaitLaosLatin AmericaLatviaLebanonLiberiaLithuaniaMalaysiaMexicoMicronesiaMiddle AfricaMoldovaMoroccoNepalNetherlandsNicaraguaNigeriaNorth AmericaNorth MacedoniaNorthern AfricaNorthern EuropeNorwayOceaniaPakistanPanamaPeruPhilippinesPolandPortugalRomaniaRussiaSaudi ArabiaScotlandSenegalSerbiaSierra LeoneSingaporeSomaliaSouth AfricaSouth AmericaSouth Central AsiaSouth Eastern AsiaSouthern EuropeSpainSri LankaSt. Vincent and the GrenadinesSudanSwedenSwitzerlandSyriaTaiwanThailandTrinidad and TobagoTurkeyUgandaUkraineUruguayUzbekistanVenezuelaVietnamWest IndiesWestern AfricaWestern AsiaWestern EuropeYemenZaireZimbabweAzores
Immigrants from Austria
Race
Ancestry
AfghanAfricanAlaska NativeAlaskan AthabascanAlbanianAleutAlsatianAmericanApacheArabArapahoArgentineanArmenianAssyrian/Chaldean/SyriacAustralianAustrianBahamianBangladeshiBarbadianBasqueBelgianBelizeanBermudanBhutaneseBlackfeetBolivianBrazilianBritishBritish West IndianBulgarianCajunCambodianCanadianCape VerdeanCarpatho RusynCelticCentral AmericanCentral American IndianCherokeeCheyenneChickasawChileanChineseChippewaChoctawColombianColvilleComancheCosta RicanCreeCreekCroatianCrowCubanCypriotCzechCzechoslovakianDanishDelawareDominicanDutchDutch West IndianEastern EuropeanEcuadorianEgyptianEnglishEstonianEthiopianEuropeanFijianFilipinoFinnishFrenchFrench American IndianFrench CanadianGermanGerman RussianGhanaianGreekGuamanian/ChamorroGuatemalanGuyaneseHaitianHmongHonduranHopiHoumaHungarianIcelanderIndian (Asian)IndonesianInupiatIranianIraqiIrishIroquoisIsraeliItalianJamaicanJapaneseJordanianKenyanKiowaKoreanLaotianLatvianLebaneseLiberianLithuanianLumbeeLuxembourgerMacedonianMalaysianMalteseMarshalleseMenomineeMexicanMexican American IndianMongolianMoroccanNative HawaiianNavajoNepaleseNew ZealanderNicaraguanNigerianNorthern EuropeanNorwegianOkinawanOsageOttawaPaiutePakistaniPalestinianPanamanianParaguayanPennsylvania GermanPeruvianPimaPolishPortuguesePotawatomiPuebloPuerto RicanPuget Sound SalishRomanianRussianSalvadoranSamoanScandinavianScotch-IrishScottishSeminoleSenegaleseSerbianShoshoneSierra LeoneanSiouxSlavicSlovakSloveneSomaliSouth AfricanSouth AmericanSouth American IndianSoviet UnionSpaniardSpanishSpanish AmericanSpanish American IndianSri LankanSubsaharan AfricanSudaneseSwedishSwissSyrianTaiwaneseThaiTlingit-HaidaTohono O'OdhamTonganTrinidadian and TobagonianTsimshianTurkishU.S. Virgin IslanderUgandanUkrainianUruguayanUteVenezuelanVietnameseWelshWest IndianYakamaYaquiYugoslavianYumanYup'ikZimbabwean
Immigration
NonimmigrantsImmigrantsAfghanistanAfricaAlbaniaArgentinaArmeniaAsiaAustraliaAustriaBahamasBangladeshBarbadosBelarusBelgiumBelizeBoliviaBosnia and HerzegovinaBrazilBulgariaBurma/MyanmarCabo VerdeCambodiaCameroonCanadaCaribbeanCentral AmericaChileChinaColombiaCongoCosta RicaCroatiaCubaCzechoslovakiaDenmarkDominicaDominican RepublicEastern AfricaEastern AsiaEastern EuropeEcuadorEgyptEl SalvadorEnglandEritreaEthiopiaEuropeFijiFranceGermanyGhanaGreeceGrenadaGuatemalaGuyanaHaitiHondurasHong KongHungaryIndiaIndonesiaIranIraqIrelandIsraelItalyJamaicaJapanJordanKazakhstanKenyaKoreaKuwaitLaosLatin AmericaLatviaLebanonLiberiaLithuaniaMalaysiaMexicoMicronesiaMiddle AfricaMoldovaMoroccoNepalNetherlandsNicaraguaNigeriaNorth AmericaNorth MacedoniaNorthern AfricaNorthern EuropeNorwayOceaniaPakistanPanamaPeruPhilippinesPolandPortugalRomaniaRussiaSaudi ArabiaScotlandSenegalSerbiaSierra LeoneSingaporeSomaliaSouth AfricaSouth AmericaSouth Central AsiaSouth Eastern AsiaSouthern EuropeSpainSri LankaSt. Vincent and the GrenadinesSudanSwedenSwitzerlandSyriaTaiwanThailandTrinidad and TobagoTurkeyUgandaUkraineUruguayUzbekistanVenezuelaVietnamWest IndiesWestern AfricaWestern AsiaWestern EuropeYemenZaireZimbabweAzores
Child Poverty Under the Age of 5
Income
Poverty
Unemployment
Labor Participation
Family Structure
Vehicle Availability
Education Level
Disability

Child Poverty Under the Age of 5 Comparison

Burmese

Immigrants from Austria

Exceptional
Exceptional
13.2%
CHILD POVERTY UNDER THE AGE OF 5
100.0/ 100
METRIC RATING
10th/ 347
METRIC RANK
16.0%
CHILD POVERTY UNDER THE AGE OF 5
93.5/ 100
METRIC RATING
116th/ 347
METRIC RANK

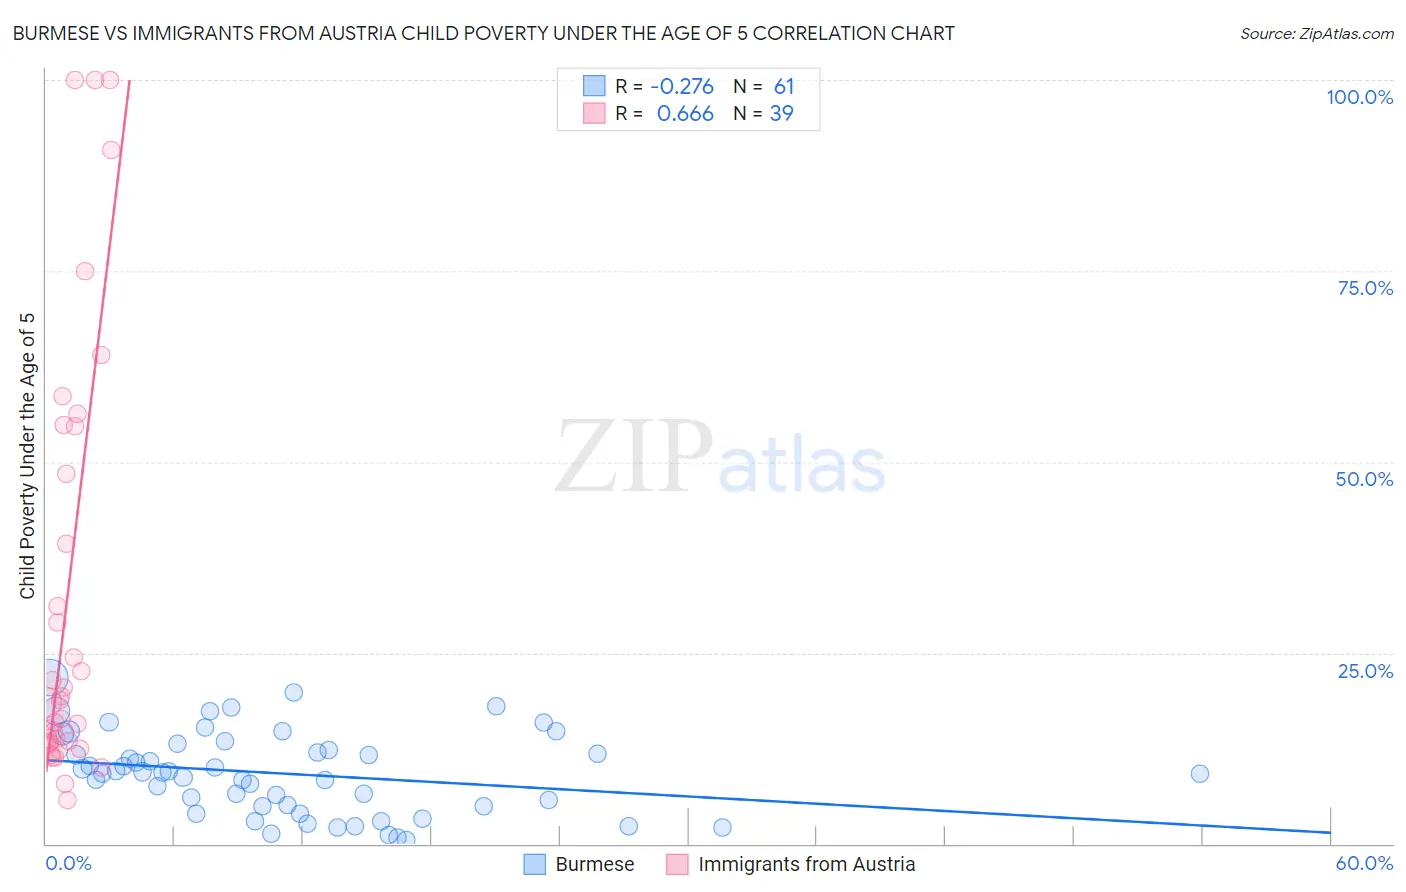
Burmese vs Immigrants from Austria Child Poverty Under the Age of 5 Correlation Chart

The statistical analysis conducted on geographies consisting of 442,195,758 people shows a weak negative correlation between the proportion of Burmese and poverty level among children under the age of 5 in the United States with a correlation coefficient (R) of -0.276 and weighted average of 13.2%. Similarly, the statistical analysis conducted on geographies consisting of 162,753,273 people shows a significant positive correlation between the proportion of Immigrants from Austria and poverty level among children under the age of 5 in the United States with a correlation coefficient (R) of 0.666 and weighted average of 16.0%, a difference of 21.3%.
Burmese vs Immigrants from Austria Child Poverty Under the Age of 5

Child Poverty Under the Age of 5 Correlation Summary

MeasurementBurmeseImmigrants from Austria
Minimum0.42%5.8%
Maximum21.8%100.0%
Range21.3%94.2%
Mean9.2%32.7%
Median9.3%18.8%
Interquartile 25% (IQ1)4.9%13.3%
Interquartile 75% (IQ3)12.7%54.7%
Interquartile Range (IQR)7.8%41.4%
Standard Deviation (Sample)5.3%28.4%
Standard Deviation (Population)5.2%28.0%

Similar Demographics by Child Poverty Under the Age of 5

Demographics Similar to Burmese by Child Poverty Under the Age of 5

In terms of child poverty under the age of 5, the demographic groups most similar to Burmese are Immigrants from Korea (13.2%, a difference of 0.11%), Immigrants from South Central Asia (13.3%, a difference of 0.21%), Bhutanese (13.4%, a difference of 0.96%), Immigrants from Iran (13.1%, a difference of 1.1%), and Iranian (13.1%, a difference of 1.3%).
DemographicsRating | RankChild Poverty Under the Age of 5
Filipinos
100.0
/100
|
#3
Exceptional
11.6%
Thais
100.0
/100
|
#4
Exceptional
12.3%
Immigrants | Hong Kong
100.0
/100
|
#5
Exceptional
12.4%
Immigrants | Singapore
100.0
/100
|
#6
Exceptional
12.9%
Chinese
100.0
/100
|
#7
Exceptional
13.1%
Iranians
100.0
/100
|
#8
Exceptional
13.1%
Immigrants | Iran
100.0
/100
|
#9
Exceptional
13.1%
Burmese
100.0
/100
|
#10
Exceptional
13.2%
Immigrants | Korea
100.0
/100
|
#11
Exceptional
13.2%
Immigrants | South Central Asia
100.0
/100
|
#12
Exceptional
13.3%
Bhutanese
100.0
/100
|
#13
Exceptional
13.4%
Okinawans
100.0
/100
|
#14
Exceptional
13.4%
Indians (Asian)
100.0
/100
|
#15
Exceptional
13.4%
Immigrants | Eastern Asia
100.0
/100
|
#16
Exceptional
13.5%
Assyrians/Chaldeans/Syriacs
100.0
/100
|
#17
Exceptional
13.6%

Demographics Similar to Immigrants from Austria by Child Poverty Under the Age of 5

In terms of child poverty under the age of 5, the demographic groups most similar to Immigrants from Austria are Basque (16.0%, a difference of 0.020%), Immigrants from Denmark (16.0%, a difference of 0.020%), Immigrants from Jordan (16.1%, a difference of 0.13%), Albanian (16.0%, a difference of 0.17%), and Immigrants from Kuwait (16.0%, a difference of 0.19%).
DemographicsRating | RankChild Poverty Under the Age of 5
Northern Europeans
94.3
/100
|
#109
Exceptional
16.0%
Romanians
94.3
/100
|
#110
Exceptional
16.0%
Pakistanis
94.2
/100
|
#111
Exceptional
16.0%
Peruvians
94.1
/100
|
#112
Exceptional
16.0%
Puget Sound Salish
94.1
/100
|
#113
Exceptional
16.0%
Immigrants | Kuwait
93.9
/100
|
#114
Exceptional
16.0%
Albanians
93.8
/100
|
#115
Exceptional
16.0%
Immigrants | Austria
93.5
/100
|
#116
Exceptional
16.0%
Basques
93.4
/100
|
#117
Exceptional
16.0%
Immigrants | Denmark
93.4
/100
|
#118
Exceptional
16.0%
Immigrants | Jordan
93.2
/100
|
#119
Exceptional
16.1%
Immigrants | Peru
92.6
/100
|
#120
Exceptional
16.1%
Mongolians
92.5
/100
|
#121
Exceptional
16.1%
Immigrants | Southern Europe
92.0
/100
|
#122
Exceptional
16.1%
Austrians
92.0
/100
|
#123
Exceptional
16.1%