Burmese vs Chilean Child Poverty Under the Age of 5
COMPARE
Burmese
Chilean
Child Poverty Under the Age of 5
Child Poverty Under the Age of 5 Comparison
Burmese
Chileans
13.2%
CHILD POVERTY UNDER THE AGE OF 5
100.0/ 100
METRIC RATING
10th/ 347
METRIC RANK
15.6%
CHILD POVERTY UNDER THE AGE OF 5
97.6/ 100
METRIC RATING
83rd/ 347
METRIC RANK
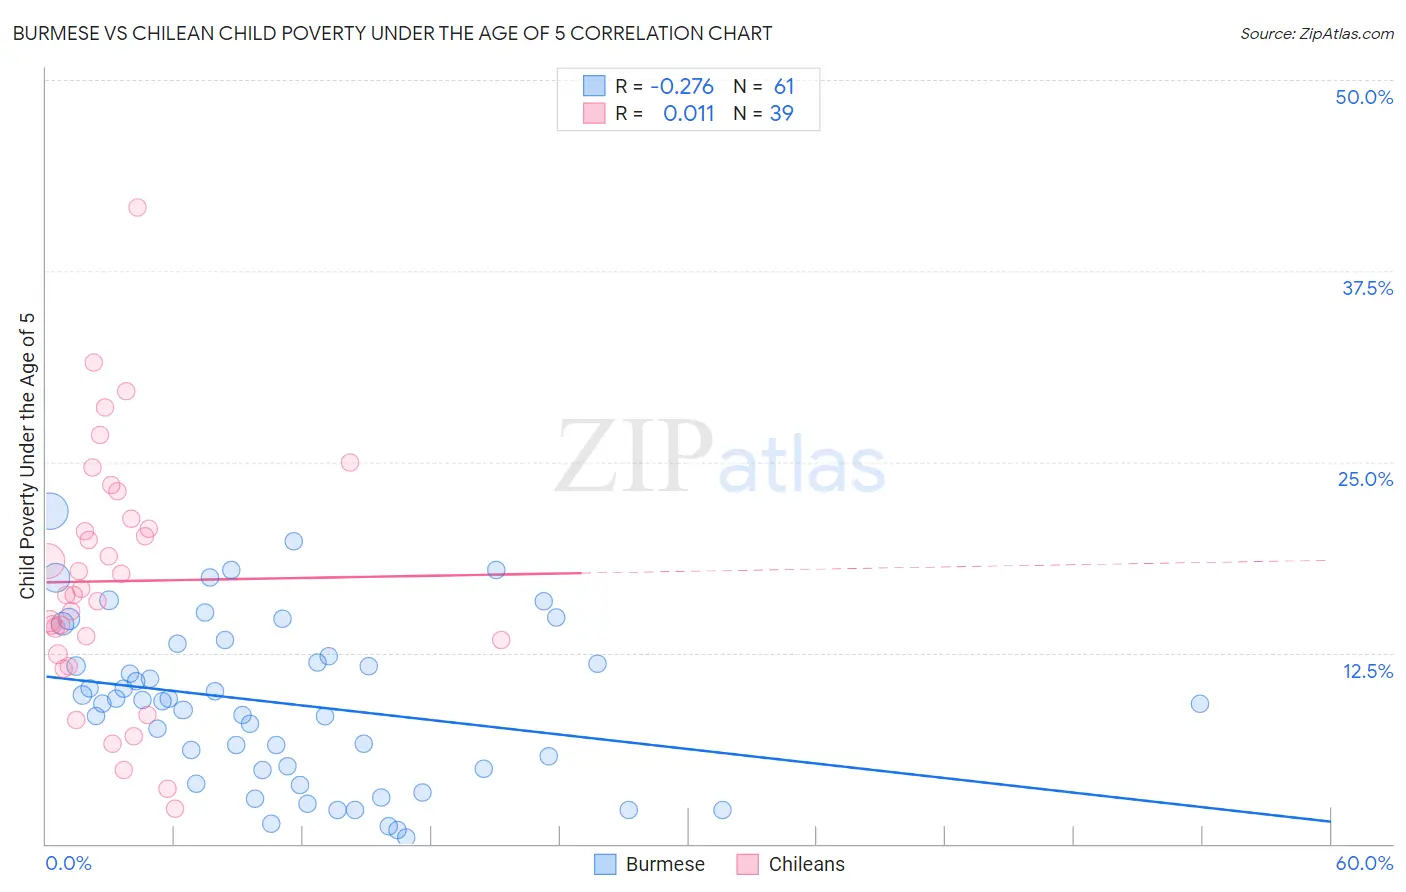
Burmese vs Chilean Child Poverty Under the Age of 5 Correlation Chart
The statistical analysis conducted on geographies consisting of 442,195,758 people shows a weak negative correlation between the proportion of Burmese and poverty level among children under the age of 5 in the United States with a correlation coefficient (R) of -0.276 and weighted average of 13.2%. Similarly, the statistical analysis conducted on geographies consisting of 249,794,467 people shows no correlation between the proportion of Chileans and poverty level among children under the age of 5 in the United States with a correlation coefficient (R) of 0.011 and weighted average of 15.6%, a difference of 17.8%.
Child Poverty Under the Age of 5 Correlation Summary
| Measurement | Burmese | Chilean |
| Minimum | 0.42% | 2.3% |
| Maximum | 21.8% | 41.7% |
| Range | 21.3% | 39.4% |
| Mean | 9.2% | 17.2% |
| Median | 9.3% | 16.3% |
| Interquartile 25% (IQ1) | 4.9% | 12.4% |
| Interquartile 75% (IQ3) | 12.7% | 21.3% |
| Interquartile Range (IQR) | 7.8% | 8.9% |
| Standard Deviation (Sample) | 5.3% | 8.1% |
| Standard Deviation (Population) | 5.2% | 8.0% |
Similar Demographics by Child Poverty Under the Age of 5
Demographics Similar to Burmese by Child Poverty Under the Age of 5
In terms of child poverty under the age of 5, the demographic groups most similar to Burmese are Immigrants from Korea (13.2%, a difference of 0.11%), Immigrants from South Central Asia (13.3%, a difference of 0.21%), Bhutanese (13.4%, a difference of 0.96%), Immigrants from Iran (13.1%, a difference of 1.1%), and Iranian (13.1%, a difference of 1.3%).
| Demographics | Rating | Rank | Child Poverty Under the Age of 5 |
| Filipinos | 100.0 /100 | #3 | Exceptional 11.6% |
| Thais | 100.0 /100 | #4 | Exceptional 12.3% |
| Immigrants | Hong Kong | 100.0 /100 | #5 | Exceptional 12.4% |
| Immigrants | Singapore | 100.0 /100 | #6 | Exceptional 12.9% |
| Chinese | 100.0 /100 | #7 | Exceptional 13.1% |
| Iranians | 100.0 /100 | #8 | Exceptional 13.1% |
| Immigrants | Iran | 100.0 /100 | #9 | Exceptional 13.1% |
| Burmese | 100.0 /100 | #10 | Exceptional 13.2% |
| Immigrants | Korea | 100.0 /100 | #11 | Exceptional 13.2% |
| Immigrants | South Central Asia | 100.0 /100 | #12 | Exceptional 13.3% |
| Bhutanese | 100.0 /100 | #13 | Exceptional 13.4% |
| Okinawans | 100.0 /100 | #14 | Exceptional 13.4% |
| Indians (Asian) | 100.0 /100 | #15 | Exceptional 13.4% |
| Immigrants | Eastern Asia | 100.0 /100 | #16 | Exceptional 13.5% |
| Assyrians/Chaldeans/Syriacs | 100.0 /100 | #17 | Exceptional 13.6% |
Demographics Similar to Chileans by Child Poverty Under the Age of 5
In terms of child poverty under the age of 5, the demographic groups most similar to Chileans are Immigrants from Netherlands (15.6%, a difference of 0.020%), Immigrants from Italy (15.6%, a difference of 0.16%), Immigrants from Latvia (15.6%, a difference of 0.18%), Immigrants from Malaysia (15.6%, a difference of 0.18%), and Immigrants from Vietnam (15.6%, a difference of 0.26%).
| Demographics | Rating | Rank | Child Poverty Under the Age of 5 |
| Croatians | 98.5 /100 | #76 | Exceptional 15.4% |
| Immigrants | Turkey | 98.3 /100 | #77 | Exceptional 15.4% |
| Sri Lankans | 98.1 /100 | #78 | Exceptional 15.5% |
| Australians | 98.0 /100 | #79 | Exceptional 15.5% |
| Italians | 97.9 /100 | #80 | Exceptional 15.5% |
| Czechs | 97.8 /100 | #81 | Exceptional 15.5% |
| Immigrants | Italy | 97.7 /100 | #82 | Exceptional 15.6% |
| Chileans | 97.6 /100 | #83 | Exceptional 15.6% |
| Immigrants | Netherlands | 97.6 /100 | #84 | Exceptional 15.6% |
| Immigrants | Latvia | 97.4 /100 | #85 | Exceptional 15.6% |
| Immigrants | Malaysia | 97.4 /100 | #86 | Exceptional 15.6% |
| Immigrants | Vietnam | 97.4 /100 | #87 | Exceptional 15.6% |
| Jordanians | 97.3 /100 | #88 | Exceptional 15.6% |
| Immigrants | Croatia | 97.3 /100 | #89 | Exceptional 15.6% |
| Immigrants | France | 97.3 /100 | #90 | Exceptional 15.6% |