Immigrants from Singapore vs Spaniard Family Poverty
COMPARE
Immigrants from Singapore
Spaniard
Family Poverty
Family Poverty Comparison
Immigrants from Singapore
Spaniards
7.1%
FAMILY POVERTY
99.8/ 100
METRIC RATING
11th/ 347
METRIC RANK
9.4%
FAMILY POVERTY
22.8/ 100
METRIC RATING
199th/ 347
METRIC RANK
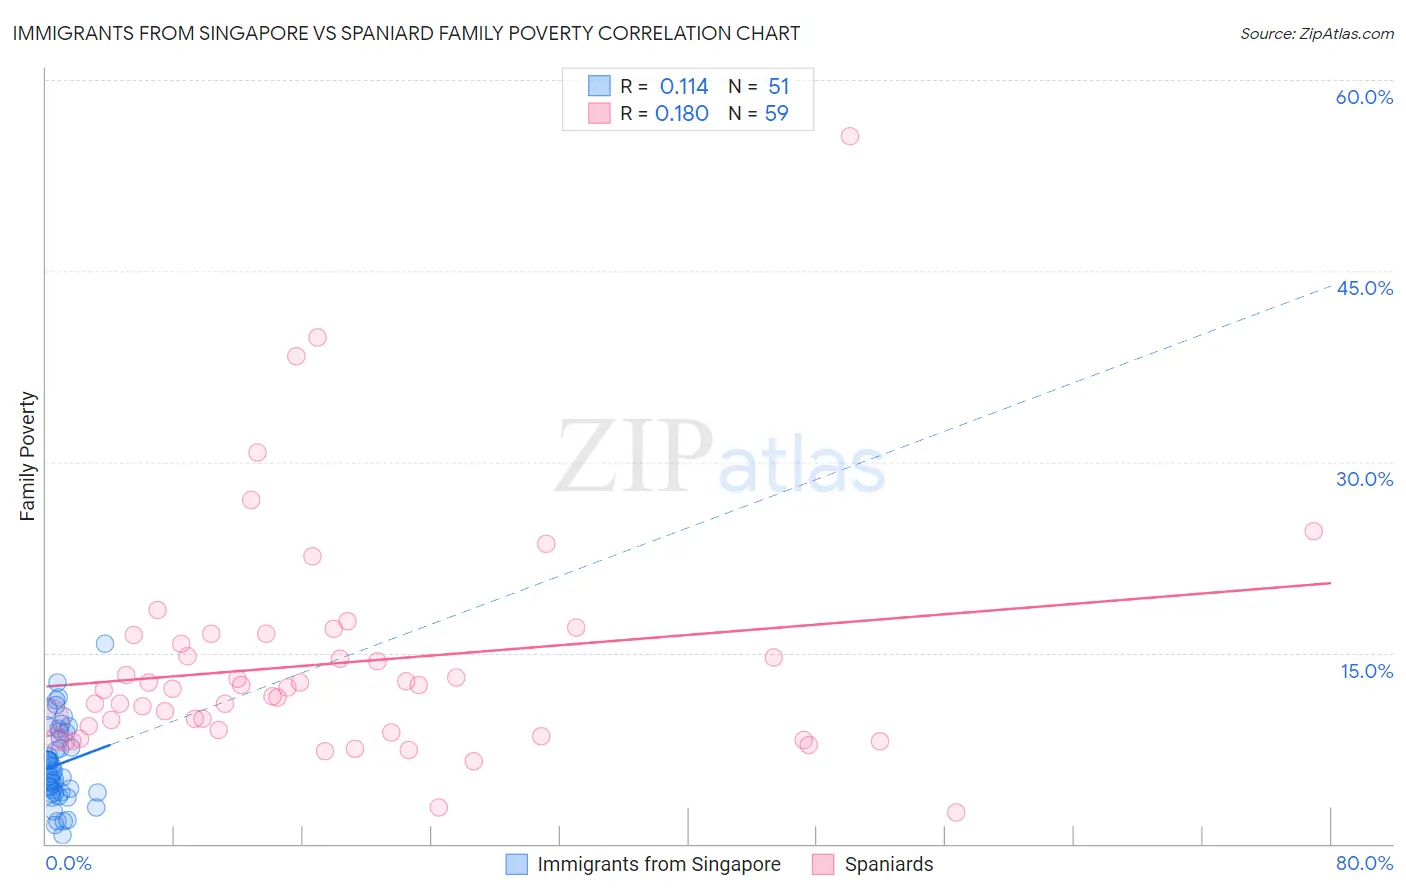
Immigrants from Singapore vs Spaniard Family Poverty Correlation Chart
The statistical analysis conducted on geographies consisting of 137,322,674 people shows a poor positive correlation between the proportion of Immigrants from Singapore and poverty level among families in the United States with a correlation coefficient (R) of 0.114 and weighted average of 7.1%. Similarly, the statistical analysis conducted on geographies consisting of 441,991,510 people shows a poor positive correlation between the proportion of Spaniards and poverty level among families in the United States with a correlation coefficient (R) of 0.180 and weighted average of 9.4%, a difference of 32.0%.
Family Poverty Correlation Summary
| Measurement | Immigrants from Singapore | Spaniard |
| Minimum | 0.70% | 2.5% |
| Maximum | 15.7% | 55.6% |
| Range | 15.0% | 53.1% |
| Mean | 6.2% | 14.2% |
| Median | 5.7% | 12.2% |
| Interquartile 25% (IQ1) | 4.0% | 8.7% |
| Interquartile 75% (IQ3) | 8.8% | 16.4% |
| Interquartile Range (IQR) | 4.8% | 7.7% |
| Standard Deviation (Sample) | 3.2% | 9.0% |
| Standard Deviation (Population) | 3.1% | 9.0% |
Similar Demographics by Family Poverty
Demographics Similar to Immigrants from Singapore by Family Poverty
In terms of family poverty, the demographic groups most similar to Immigrants from Singapore are Bulgarian (7.1%, a difference of 0.010%), Latvian (7.1%, a difference of 0.27%), Maltese (7.1%, a difference of 0.29%), Swedish (7.1%, a difference of 0.34%), and Iranian (7.1%, a difference of 0.34%).
| Demographics | Rating | Rank | Family Poverty |
| Filipinos | 100.0 /100 | #4 | Exceptional 6.6% |
| Thais | 100.0 /100 | #5 | Exceptional 6.7% |
| Norwegians | 99.9 /100 | #6 | Exceptional 6.9% |
| Immigrants | Ireland | 99.9 /100 | #7 | Exceptional 7.0% |
| Bhutanese | 99.9 /100 | #8 | Exceptional 7.0% |
| Latvians | 99.9 /100 | #9 | Exceptional 7.1% |
| Bulgarians | 99.8 /100 | #10 | Exceptional 7.1% |
| Immigrants | Singapore | 99.8 /100 | #11 | Exceptional 7.1% |
| Maltese | 99.8 /100 | #12 | Exceptional 7.1% |
| Swedes | 99.8 /100 | #13 | Exceptional 7.1% |
| Iranians | 99.8 /100 | #14 | Exceptional 7.1% |
| Lithuanians | 99.8 /100 | #15 | Exceptional 7.2% |
| Immigrants | South Central Asia | 99.8 /100 | #16 | Exceptional 7.2% |
| Luxembourgers | 99.8 /100 | #17 | Exceptional 7.2% |
| Immigrants | Lithuania | 99.8 /100 | #18 | Exceptional 7.2% |
Demographics Similar to Spaniards by Family Poverty
In terms of family poverty, the demographic groups most similar to Spaniards are Immigrants from Costa Rica (9.4%, a difference of 0.19%), Iraqi (9.3%, a difference of 0.25%), Immigrants from Colombia (9.3%, a difference of 0.28%), Immigrants from Portugal (9.4%, a difference of 0.42%), and Immigrants from Venezuela (9.3%, a difference of 0.57%).
| Demographics | Rating | Rank | Family Poverty |
| Spanish | 28.7 /100 | #192 | Fair 9.3% |
| Immigrants | Western Asia | 28.2 /100 | #193 | Fair 9.3% |
| South Americans | 28.1 /100 | #194 | Fair 9.3% |
| Venezuelans | 27.4 /100 | #195 | Fair 9.3% |
| Immigrants | Venezuela | 26.1 /100 | #196 | Fair 9.3% |
| Immigrants | Colombia | 24.4 /100 | #197 | Fair 9.3% |
| Iraqis | 24.2 /100 | #198 | Fair 9.3% |
| Spaniards | 22.8 /100 | #199 | Fair 9.4% |
| Immigrants | Costa Rica | 21.7 /100 | #200 | Fair 9.4% |
| Immigrants | Portugal | 20.5 /100 | #201 | Fair 9.4% |
| Immigrants | Sierra Leone | 19.6 /100 | #202 | Poor 9.4% |
| German Russians | 19.4 /100 | #203 | Poor 9.4% |
| Immigrants | Lebanon | 18.9 /100 | #204 | Poor 9.4% |
| Aleuts | 18.0 /100 | #205 | Poor 9.5% |
| Immigrants | South America | 18.0 /100 | #206 | Poor 9.5% |