British vs Immigrants from Philippines Receiving Food Stamps
COMPARE
British
Immigrants from Philippines
Receiving Food Stamps
Receiving Food Stamps Comparison
British
Immigrants from Philippines
9.7%
RECEIVING FOOD STAMPS
99.2/ 100
METRIC RATING
59th/ 347
METRIC RANK
10.7%
RECEIVING FOOD STAMPS
93.3/ 100
METRIC RATING
123rd/ 347
METRIC RANK
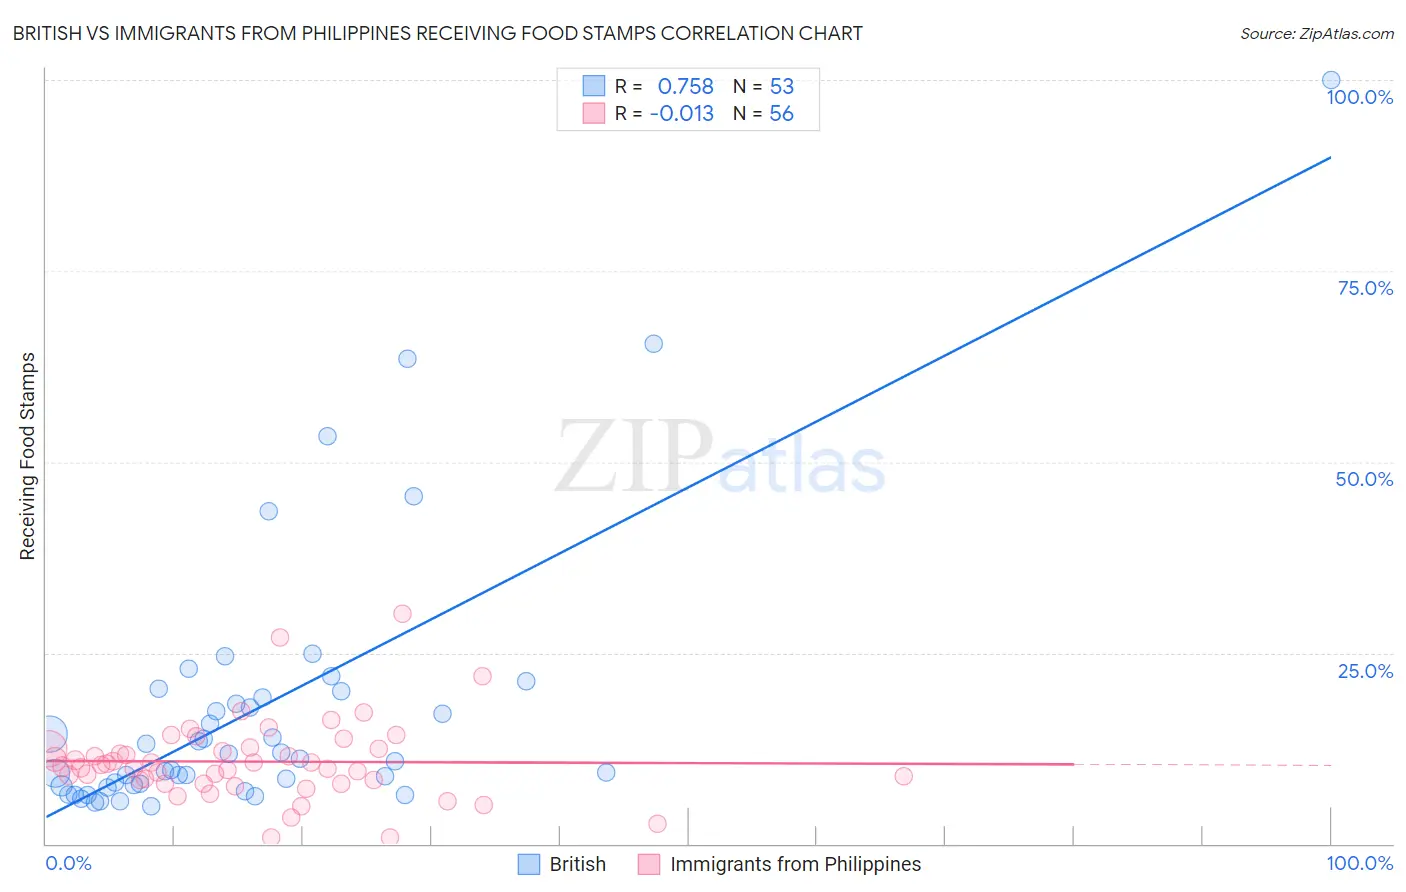
British vs Immigrants from Philippines Receiving Food Stamps Correlation Chart
The statistical analysis conducted on geographies consisting of 528,917,419 people shows a strong positive correlation between the proportion of British and percentage of population receiving government assistance and/or food stamps in the United States with a correlation coefficient (R) of 0.758 and weighted average of 9.7%. Similarly, the statistical analysis conducted on geographies consisting of 469,841,881 people shows no correlation between the proportion of Immigrants from Philippines and percentage of population receiving government assistance and/or food stamps in the United States with a correlation coefficient (R) of -0.013 and weighted average of 10.7%, a difference of 9.4%.
Receiving Food Stamps Correlation Summary
| Measurement | British | Immigrants from Philippines |
| Minimum | 4.9% | 0.80% |
| Maximum | 100.0% | 30.1% |
| Range | 95.1% | 29.3% |
| Mean | 17.6% | 10.7% |
| Median | 11.1% | 10.2% |
| Interquartile 25% (IQ1) | 7.6% | 8.1% |
| Interquartile 75% (IQ3) | 19.6% | 12.5% |
| Interquartile Range (IQR) | 12.0% | 4.3% |
| Standard Deviation (Sample) | 18.1% | 5.2% |
| Standard Deviation (Population) | 17.9% | 5.2% |
Similar Demographics by Receiving Food Stamps
Demographics Similar to British by Receiving Food Stamps
In terms of receiving food stamps, the demographic groups most similar to British are Scandinavian (9.7%, a difference of 0.030%), Greek (9.7%, a difference of 0.090%), German (9.7%, a difference of 0.10%), Immigrants from Canada (9.7%, a difference of 0.20%), and English (9.8%, a difference of 0.24%).
| Demographics | Rating | Rank | Receiving Food Stamps |
| Immigrants | South Africa | 99.3 /100 | #52 | Exceptional 9.7% |
| Tongans | 99.3 /100 | #53 | Exceptional 9.7% |
| Swiss | 99.3 /100 | #54 | Exceptional 9.7% |
| Immigrants | Switzerland | 99.3 /100 | #55 | Exceptional 9.7% |
| Immigrants | Canada | 99.3 /100 | #56 | Exceptional 9.7% |
| Greeks | 99.3 /100 | #57 | Exceptional 9.7% |
| Scandinavians | 99.2 /100 | #58 | Exceptional 9.7% |
| British | 99.2 /100 | #59 | Exceptional 9.7% |
| Germans | 99.2 /100 | #60 | Exceptional 9.7% |
| English | 99.2 /100 | #61 | Exceptional 9.8% |
| Immigrants | Bulgaria | 99.2 /100 | #62 | Exceptional 9.8% |
| Chinese | 99.2 /100 | #63 | Exceptional 9.8% |
| Immigrants | North America | 99.2 /100 | #64 | Exceptional 9.8% |
| Immigrants | Turkey | 99.1 /100 | #65 | Exceptional 9.8% |
| Slovenes | 99.1 /100 | #66 | Exceptional 9.8% |
Demographics Similar to Immigrants from Philippines by Receiving Food Stamps
In terms of receiving food stamps, the demographic groups most similar to Immigrants from Philippines are Paraguayan (10.7%, a difference of 0.21%), Sri Lankan (10.6%, a difference of 0.25%), Ukrainian (10.7%, a difference of 0.29%), Slavic (10.6%, a difference of 0.33%), and Immigrants from Poland (10.6%, a difference of 0.36%).
| Demographics | Rating | Rank | Receiving Food Stamps |
| Canadians | 94.8 /100 | #116 | Exceptional 10.5% |
| Immigrants | Nepal | 94.6 /100 | #117 | Exceptional 10.6% |
| Assyrians/Chaldeans/Syriacs | 94.1 /100 | #118 | Exceptional 10.6% |
| Immigrants | Poland | 93.9 /100 | #119 | Exceptional 10.6% |
| Ethiopians | 93.9 /100 | #120 | Exceptional 10.6% |
| Slavs | 93.8 /100 | #121 | Exceptional 10.6% |
| Sri Lankans | 93.7 /100 | #122 | Exceptional 10.6% |
| Immigrants | Philippines | 93.3 /100 | #123 | Exceptional 10.7% |
| Paraguayans | 93.0 /100 | #124 | Exceptional 10.7% |
| Ukrainians | 92.8 /100 | #125 | Exceptional 10.7% |
| Afghans | 92.6 /100 | #126 | Exceptional 10.7% |
| Immigrants | Ethiopia | 92.6 /100 | #127 | Exceptional 10.7% |
| Immigrants | Jordan | 92.5 /100 | #128 | Exceptional 10.7% |
| Yugoslavians | 92.5 /100 | #129 | Exceptional 10.7% |
| Israelis | 92.4 /100 | #130 | Exceptional 10.7% |