Blackfeet vs Tlingit-Haida Female Poverty Among 18-24 Year Olds
COMPARE
Blackfeet
Tlingit-Haida
Female Poverty Among 18-24 Year Olds
Female Poverty Among 18-24 Year Olds Comparison
Blackfeet
Tlingit-Haida
23.6%
FEMALE POVERTY AMONG 18-24 YEAR OLDS
0.0/ 100
METRIC RATING
309th/ 347
METRIC RANK
22.0%
FEMALE POVERTY AMONG 18-24 YEAR OLDS
0.0/ 100
METRIC RATING
284th/ 347
METRIC RANK
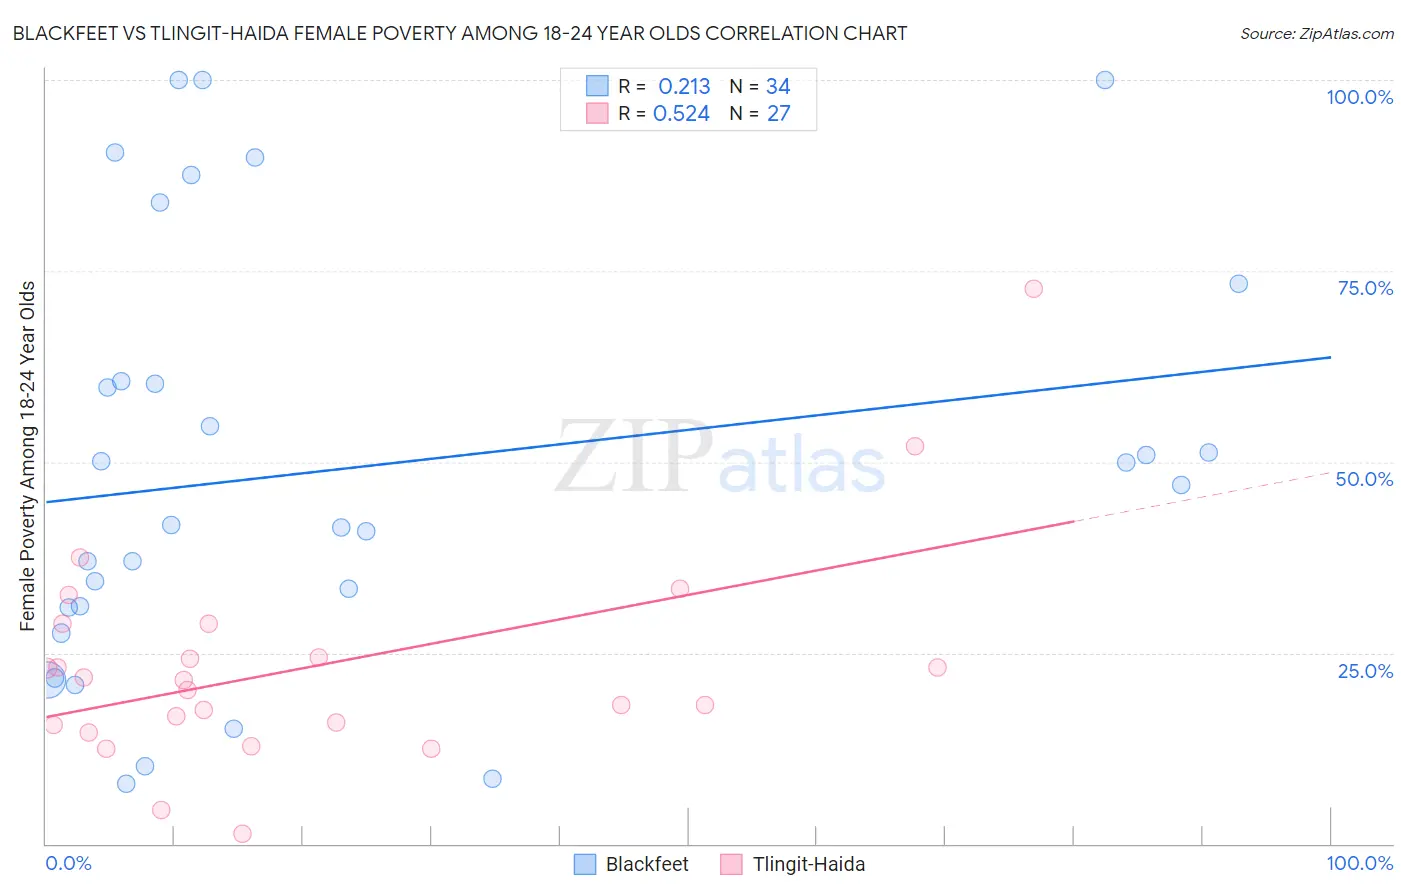
Blackfeet vs Tlingit-Haida Female Poverty Among 18-24 Year Olds Correlation Chart
The statistical analysis conducted on geographies consisting of 304,376,728 people shows a weak positive correlation between the proportion of Blackfeet and poverty level among females between the ages 18 and 24 in the United States with a correlation coefficient (R) of 0.213 and weighted average of 23.6%. Similarly, the statistical analysis conducted on geographies consisting of 60,396,606 people shows a substantial positive correlation between the proportion of Tlingit-Haida and poverty level among females between the ages 18 and 24 in the United States with a correlation coefficient (R) of 0.524 and weighted average of 22.0%, a difference of 7.2%.
Female Poverty Among 18-24 Year Olds Correlation Summary
| Measurement | Blackfeet | Tlingit-Haida |
| Minimum | 7.9% | 1.3% |
| Maximum | 100.0% | 72.7% |
| Range | 92.1% | 71.4% |
| Mean | 49.1% | 23.2% |
| Median | 44.4% | 21.4% |
| Interquartile 25% (IQ1) | 31.0% | 15.6% |
| Interquartile 75% (IQ3) | 60.5% | 28.8% |
| Interquartile Range (IQR) | 29.5% | 13.2% |
| Standard Deviation (Sample) | 27.7% | 14.2% |
| Standard Deviation (Population) | 27.2% | 13.9% |
Similar Demographics by Female Poverty Among 18-24 Year Olds
Demographics Similar to Blackfeet by Female Poverty Among 18-24 Year Olds
In terms of female poverty among 18-24 year olds, the demographic groups most similar to Blackfeet are Comanche (23.6%, a difference of 0.050%), Potawatomi (23.7%, a difference of 0.34%), Immigrants from Sudan (23.5%, a difference of 0.45%), Cree (23.4%, a difference of 0.80%), and Paiute (23.3%, a difference of 1.4%).
| Demographics | Rating | Rank | Female Poverty Among 18-24 Year Olds |
| Iroquois | 0.0 /100 | #302 | Tragic 22.9% |
| Senegalese | 0.0 /100 | #303 | Tragic 23.0% |
| Sudanese | 0.0 /100 | #304 | Tragic 23.0% |
| Immigrants | Kuwait | 0.0 /100 | #305 | Tragic 23.0% |
| Paiute | 0.0 /100 | #306 | Tragic 23.3% |
| Cree | 0.0 /100 | #307 | Tragic 23.4% |
| Immigrants | Sudan | 0.0 /100 | #308 | Tragic 23.5% |
| Blackfeet | 0.0 /100 | #309 | Tragic 23.6% |
| Comanche | 0.0 /100 | #310 | Tragic 23.6% |
| Potawatomi | 0.0 /100 | #311 | Tragic 23.7% |
| Yuman | 0.0 /100 | #312 | Tragic 24.0% |
| Creek | 0.0 /100 | #313 | Tragic 24.2% |
| Choctaw | 0.0 /100 | #314 | Tragic 24.3% |
| Blacks/African Americans | 0.0 /100 | #315 | Tragic 24.3% |
| Alsatians | 0.0 /100 | #316 | Tragic 24.4% |
Demographics Similar to Tlingit-Haida by Female Poverty Among 18-24 Year Olds
In terms of female poverty among 18-24 year olds, the demographic groups most similar to Tlingit-Haida are Subsaharan African (22.0%, a difference of 0.010%), Ottawa (22.0%, a difference of 0.12%), Bermudan (21.9%, a difference of 0.31%), Ugandan (22.1%, a difference of 0.31%), and Immigrants from Middle Africa (22.1%, a difference of 0.32%).
| Demographics | Rating | Rank | Female Poverty Among 18-24 Year Olds |
| Immigrants | Switzerland | 0.1 /100 | #277 | Tragic 21.8% |
| Yaqui | 0.1 /100 | #278 | Tragic 21.9% |
| Spanish Americans | 0.1 /100 | #279 | Tragic 21.9% |
| Immigrants | Dominica | 0.1 /100 | #280 | Tragic 21.9% |
| Immigrants | Dominican Republic | 0.1 /100 | #281 | Tragic 21.9% |
| Bermudans | 0.1 /100 | #282 | Tragic 21.9% |
| Sub-Saharan Africans | 0.0 /100 | #283 | Tragic 22.0% |
| Tlingit-Haida | 0.0 /100 | #284 | Tragic 22.0% |
| Ottawa | 0.0 /100 | #285 | Tragic 22.0% |
| Ugandans | 0.0 /100 | #286 | Tragic 22.1% |
| Immigrants | Middle Africa | 0.0 /100 | #287 | Tragic 22.1% |
| Dominicans | 0.0 /100 | #288 | Tragic 22.3% |
| French American Indians | 0.0 /100 | #289 | Tragic 22.3% |
| Immigrants | Senegal | 0.0 /100 | #290 | Tragic 22.4% |
| Bangladeshis | 0.0 /100 | #291 | Tragic 22.5% |