Belizean vs Yugoslavian Female Poverty Among 18-24 Year Olds
COMPARE
Belizean
Yugoslavian
Female Poverty Among 18-24 Year Olds
Female Poverty Among 18-24 Year Olds Comparison
Belizeans
Yugoslavians
20.1%
FEMALE POVERTY AMONG 18-24 YEAR OLDS
52.0/ 100
METRIC RATING
172nd/ 347
METRIC RANK
19.8%
FEMALE POVERTY AMONG 18-24 YEAR OLDS
79.0/ 100
METRIC RATING
152nd/ 347
METRIC RANK
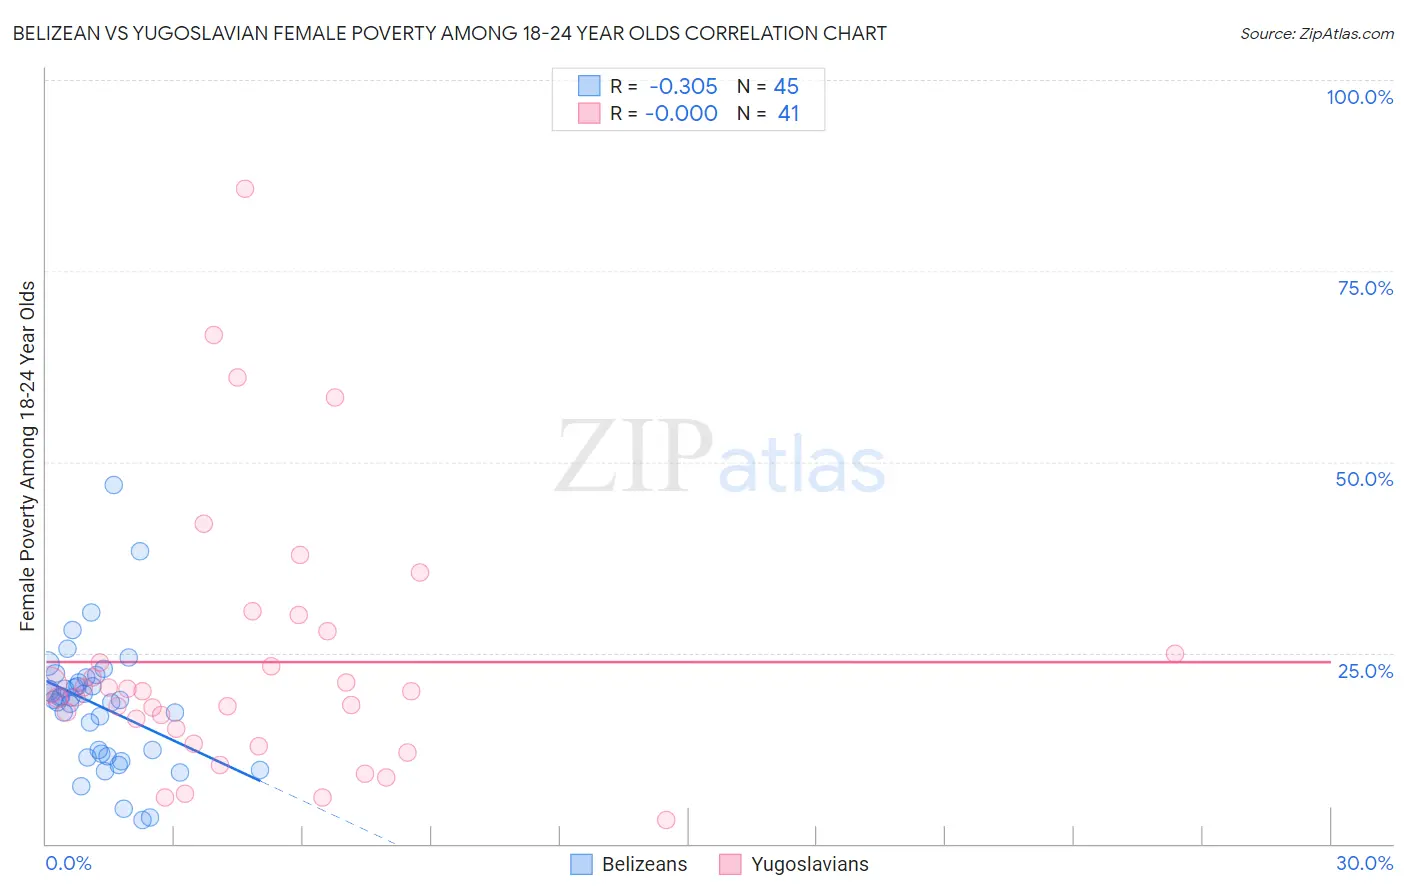
Belizean vs Yugoslavian Female Poverty Among 18-24 Year Olds Correlation Chart
The statistical analysis conducted on geographies consisting of 143,351,984 people shows a mild negative correlation between the proportion of Belizeans and poverty level among females between the ages 18 and 24 in the United States with a correlation coefficient (R) of -0.305 and weighted average of 20.1%. Similarly, the statistical analysis conducted on geographies consisting of 280,461,515 people shows no correlation between the proportion of Yugoslavians and poverty level among females between the ages 18 and 24 in the United States with a correlation coefficient (R) of -0.000 and weighted average of 19.8%, a difference of 1.5%.
Female Poverty Among 18-24 Year Olds Correlation Summary
| Measurement | Belizean | Yugoslavian |
| Minimum | 3.2% | 3.2% |
| Maximum | 47.0% | 85.7% |
| Range | 43.8% | 82.5% |
| Mean | 18.1% | 23.8% |
| Median | 18.8% | 20.0% |
| Interquartile 25% (IQ1) | 11.7% | 14.1% |
| Interquartile 75% (IQ3) | 21.4% | 26.3% |
| Interquartile Range (IQR) | 9.7% | 12.2% |
| Standard Deviation (Sample) | 8.3% | 17.2% |
| Standard Deviation (Population) | 8.2% | 17.0% |
Demographics Similar to Belizeans and Yugoslavians by Female Poverty Among 18-24 Year Olds
In terms of female poverty among 18-24 year olds, the demographic groups most similar to Belizeans are Immigrants from Nigeria (20.1%, a difference of 0.11%), Iranian (20.1%, a difference of 0.13%), Hmong (20.0%, a difference of 0.17%), Fijian (20.0%, a difference of 0.35%), and Czechoslovakian (20.0%, a difference of 0.49%). Similarly, the demographic groups most similar to Yugoslavians are Immigrants from Japan (19.8%, a difference of 0.060%), Immigrants from Zimbabwe (19.8%, a difference of 0.17%), Hungarian (19.8%, a difference of 0.17%), Immigrants from Belgium (19.8%, a difference of 0.18%), and Danish (19.8%, a difference of 0.25%).
| Demographics | Rating | Rank | Female Poverty Among 18-24 Year Olds |
| Yugoslavians | 79.0 /100 | #152 | Good 19.8% |
| Immigrants | Japan | 78.1 /100 | #153 | Good 19.8% |
| Immigrants | Zimbabwe | 76.7 /100 | #154 | Good 19.8% |
| Hungarians | 76.6 /100 | #155 | Good 19.8% |
| Immigrants | Belgium | 76.4 /100 | #156 | Good 19.8% |
| Danes | 75.5 /100 | #157 | Good 19.8% |
| Immigrants | Lebanon | 75.3 /100 | #158 | Good 19.8% |
| Trinidadians and Tobagonians | 74.4 /100 | #159 | Good 19.8% |
| Pakistanis | 74.1 /100 | #160 | Good 19.8% |
| Immigrants | Belize | 74.1 /100 | #161 | Good 19.8% |
| French Canadians | 73.0 /100 | #162 | Good 19.9% |
| Malaysians | 72.7 /100 | #163 | Good 19.9% |
| Central Americans | 70.0 /100 | #164 | Good 19.9% |
| Eastern Europeans | 69.3 /100 | #165 | Good 19.9% |
| Belgians | 69.1 /100 | #166 | Good 19.9% |
| Czechoslovakians | 61.8 /100 | #167 | Good 20.0% |
| Fijians | 59.1 /100 | #168 | Average 20.0% |
| Hmong | 55.4 /100 | #169 | Average 20.0% |
| Iranians | 54.7 /100 | #170 | Average 20.1% |
| Immigrants | Nigeria | 54.3 /100 | #171 | Average 20.1% |
| Belizeans | 52.0 /100 | #172 | Average 20.1% |