Belizean vs Yugoslavian Female Poverty Among 25-34 Year Olds
COMPARE
Belizean
Yugoslavian
Female Poverty Among 25-34 Year Olds
Female Poverty Among 25-34 Year Olds Comparison
Belizeans
Yugoslavians
15.1%
FEMALE POVERTY AMONG 25-34 YEAR OLDS
0.4/ 100
METRIC RATING
252nd/ 347
METRIC RANK
13.6%
FEMALE POVERTY AMONG 25-34 YEAR OLDS
45.0/ 100
METRIC RATING
176th/ 347
METRIC RANK
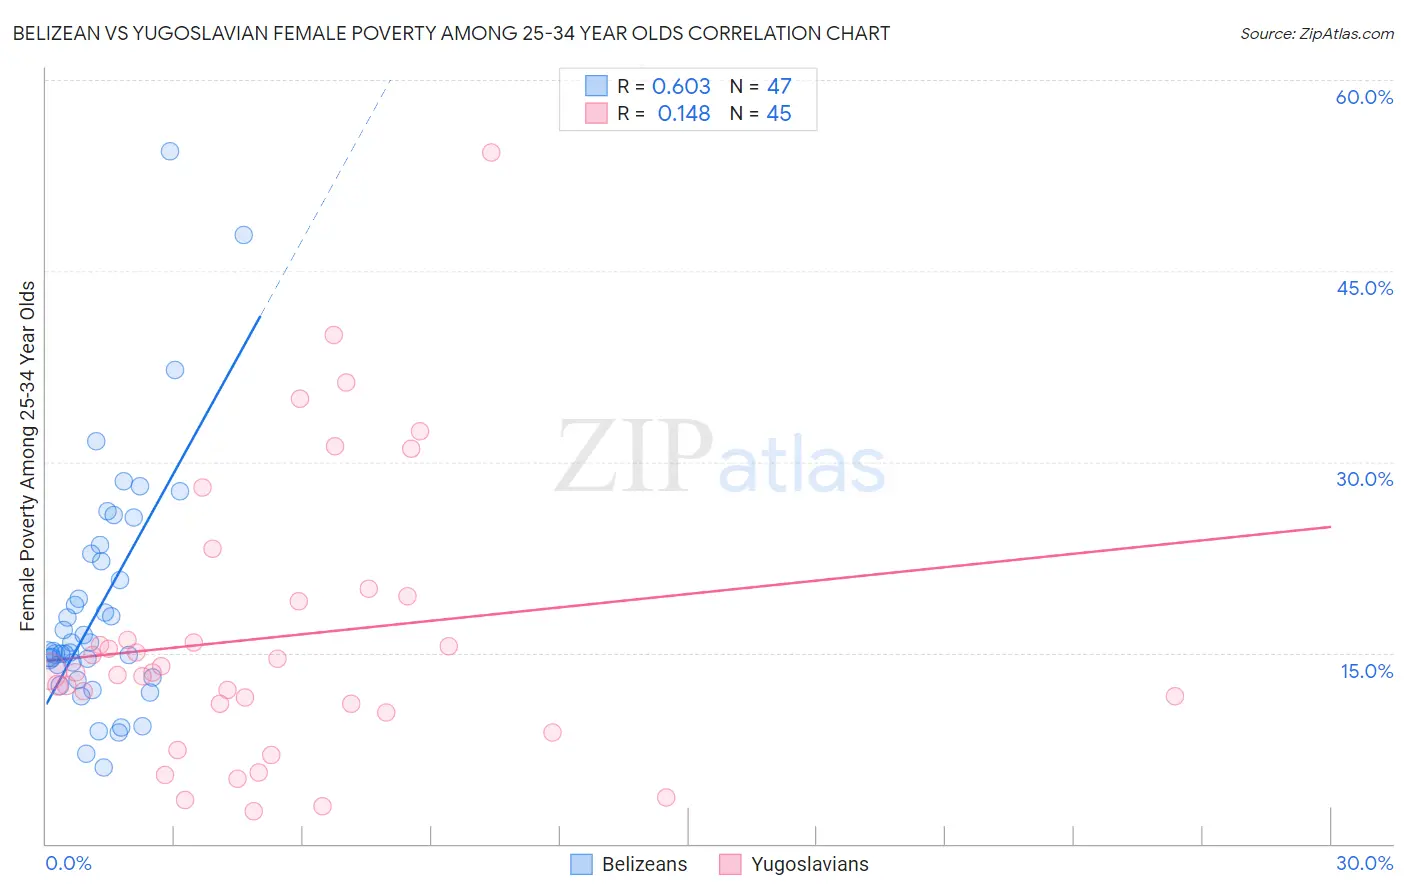
Belizean vs Yugoslavian Female Poverty Among 25-34 Year Olds Correlation Chart
The statistical analysis conducted on geographies consisting of 143,799,861 people shows a significant positive correlation between the proportion of Belizeans and poverty level among females between the ages 25 and 34 in the United States with a correlation coefficient (R) of 0.603 and weighted average of 15.1%. Similarly, the statistical analysis conducted on geographies consisting of 282,185,562 people shows a poor positive correlation between the proportion of Yugoslavians and poverty level among females between the ages 25 and 34 in the United States with a correlation coefficient (R) of 0.148 and weighted average of 13.6%, a difference of 10.8%.
Female Poverty Among 25-34 Year Olds Correlation Summary
| Measurement | Belizean | Yugoslavian |
| Minimum | 6.0% | 2.5% |
| Maximum | 54.4% | 54.3% |
| Range | 48.4% | 51.8% |
| Mean | 18.7% | 16.2% |
| Median | 15.1% | 13.4% |
| Interquartile 25% (IQ1) | 13.0% | 10.6% |
| Interquartile 75% (IQ3) | 22.8% | 19.2% |
| Interquartile Range (IQR) | 9.8% | 8.6% |
| Standard Deviation (Sample) | 9.6% | 10.9% |
| Standard Deviation (Population) | 9.5% | 10.7% |
Similar Demographics by Female Poverty Among 25-34 Year Olds
Demographics Similar to Belizeans by Female Poverty Among 25-34 Year Olds
In terms of female poverty among 25-34 year olds, the demographic groups most similar to Belizeans are Immigrants from West Indies (15.1%, a difference of 0.14%), Haitian (15.0%, a difference of 0.17%), Somali (15.1%, a difference of 0.22%), Immigrants from El Salvador (15.0%, a difference of 0.36%), and Immigrants from Haiti (15.0%, a difference of 0.39%).
| Demographics | Rating | Rank | Female Poverty Among 25-34 Year Olds |
| Immigrants | Middle Africa | 1.0 /100 | #245 | Tragic 14.8% |
| Jamaicans | 1.0 /100 | #246 | Tragic 14.8% |
| German Russians | 0.8 /100 | #247 | Tragic 14.9% |
| Immigrants | Western Africa | 0.8 /100 | #248 | Tragic 14.9% |
| Immigrants | Haiti | 0.5 /100 | #249 | Tragic 15.0% |
| Immigrants | El Salvador | 0.5 /100 | #250 | Tragic 15.0% |
| Haitians | 0.5 /100 | #251 | Tragic 15.0% |
| Belizeans | 0.4 /100 | #252 | Tragic 15.1% |
| Immigrants | West Indies | 0.4 /100 | #253 | Tragic 15.1% |
| Somalis | 0.4 /100 | #254 | Tragic 15.1% |
| Immigrants | Laos | 0.3 /100 | #255 | Tragic 15.2% |
| West Indians | 0.3 /100 | #256 | Tragic 15.2% |
| Immigrants | Burma/Myanmar | 0.3 /100 | #257 | Tragic 15.2% |
| Nepalese | 0.2 /100 | #258 | Tragic 15.2% |
| Immigrants | Cuba | 0.2 /100 | #259 | Tragic 15.2% |
Demographics Similar to Yugoslavians by Female Poverty Among 25-34 Year Olds
In terms of female poverty among 25-34 year olds, the demographic groups most similar to Yugoslavians are Venezuelan (13.6%, a difference of 0.030%), Canadian (13.6%, a difference of 0.060%), Immigrants from Eastern Africa (13.6%, a difference of 0.12%), Bermudan (13.6%, a difference of 0.15%), and German (13.6%, a difference of 0.29%).
| Demographics | Rating | Rank | Female Poverty Among 25-34 Year Olds |
| Samoans | 56.8 /100 | #169 | Average 13.5% |
| Immigrants | Uganda | 53.0 /100 | #170 | Average 13.5% |
| South American Indians | 51.9 /100 | #171 | Average 13.5% |
| Immigrants | Costa Rica | 51.9 /100 | #172 | Average 13.5% |
| Kenyans | 51.8 /100 | #173 | Average 13.5% |
| Immigrants | Oceania | 50.0 /100 | #174 | Average 13.5% |
| Bermudans | 46.8 /100 | #175 | Average 13.6% |
| Yugoslavians | 45.0 /100 | #176 | Average 13.6% |
| Venezuelans | 44.6 /100 | #177 | Average 13.6% |
| Canadians | 44.3 /100 | #178 | Average 13.6% |
| Immigrants | Eastern Africa | 43.6 /100 | #179 | Average 13.6% |
| Germans | 41.6 /100 | #180 | Average 13.6% |
| Guamanians/Chamorros | 41.5 /100 | #181 | Average 13.6% |
| Immigrants | Venezuela | 40.7 /100 | #182 | Average 13.6% |
| Portuguese | 40.3 /100 | #183 | Average 13.6% |