Austrian vs Immigrants from Jamaica Female Poverty Among 18-24 Year Olds
COMPARE
Austrian
Immigrants from Jamaica
Female Poverty Among 18-24 Year Olds
Female Poverty Among 18-24 Year Olds Comparison
Austrians
Immigrants from Jamaica
19.5%
FEMALE POVERTY AMONG 18-24 YEAR OLDS
90.7/ 100
METRIC RATING
137th/ 347
METRIC RANK
18.9%
FEMALE POVERTY AMONG 18-24 YEAR OLDS
99.2/ 100
METRIC RATING
87th/ 347
METRIC RANK
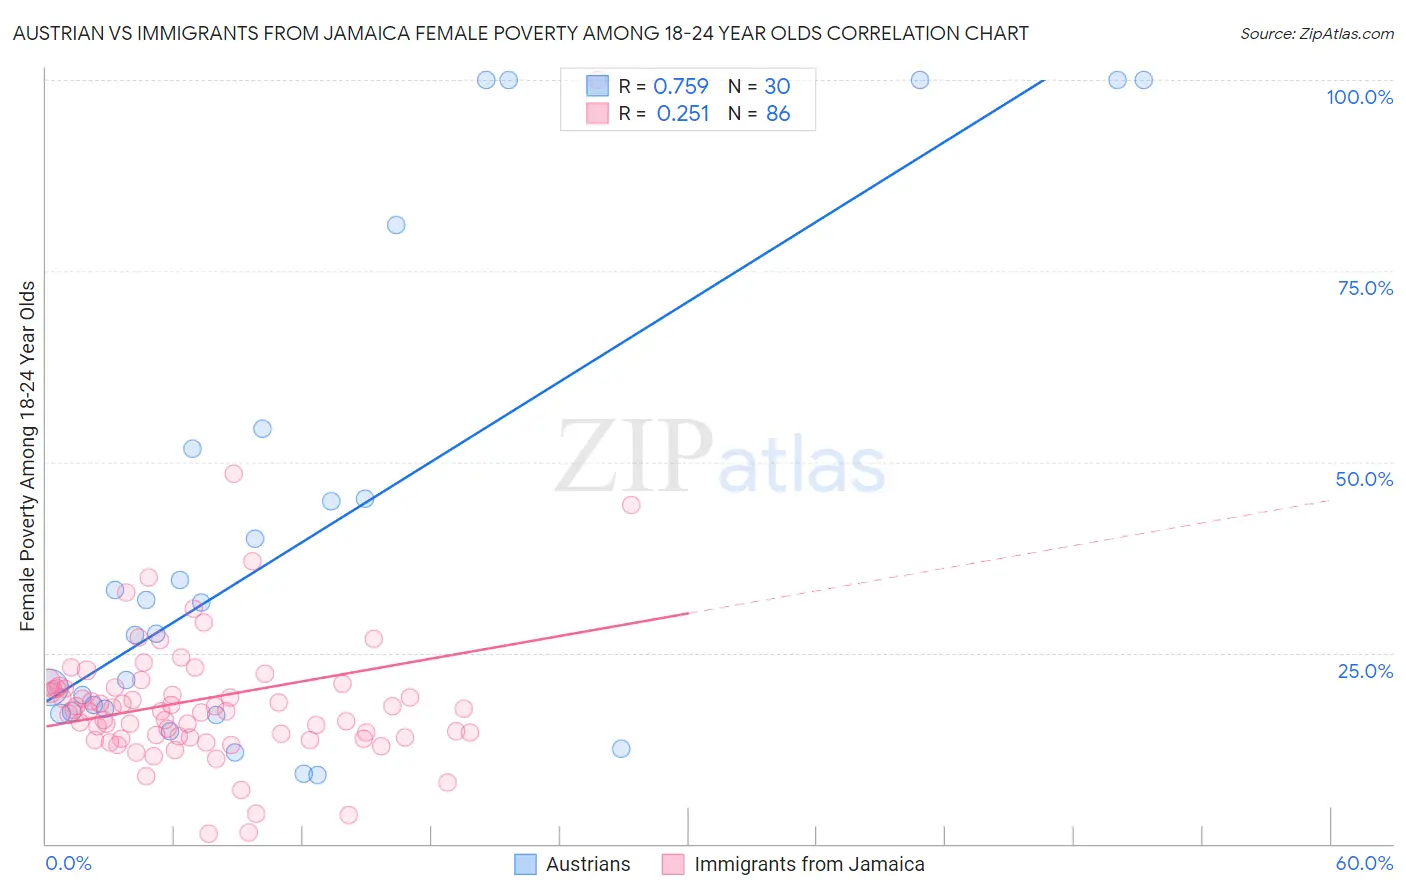
Austrian vs Immigrants from Jamaica Female Poverty Among 18-24 Year Olds Correlation Chart
The statistical analysis conducted on geographies consisting of 434,794,519 people shows a strong positive correlation between the proportion of Austrians and poverty level among females between the ages 18 and 24 in the United States with a correlation coefficient (R) of 0.759 and weighted average of 19.5%. Similarly, the statistical analysis conducted on geographies consisting of 296,183,759 people shows a weak positive correlation between the proportion of Immigrants from Jamaica and poverty level among females between the ages 18 and 24 in the United States with a correlation coefficient (R) of 0.251 and weighted average of 18.9%, a difference of 3.2%.
Female Poverty Among 18-24 Year Olds Correlation Summary
| Measurement | Austrian | Immigrants from Jamaica |
| Minimum | 9.1% | 1.3% |
| Maximum | 100.0% | 100.0% |
| Range | 90.9% | 98.7% |
| Mean | 40.3% | 19.0% |
| Median | 29.5% | 17.4% |
| Interquartile 25% (IQ1) | 17.3% | 14.0% |
| Interquartile 75% (IQ3) | 51.8% | 20.4% |
| Interquartile Range (IQR) | 34.5% | 6.5% |
| Standard Deviation (Sample) | 31.3% | 11.7% |
| Standard Deviation (Population) | 30.8% | 11.6% |
Similar Demographics by Female Poverty Among 18-24 Year Olds
Demographics Similar to Austrians by Female Poverty Among 18-24 Year Olds
In terms of female poverty among 18-24 year olds, the demographic groups most similar to Austrians are Russian (19.5%, a difference of 0.12%), Immigrants from Morocco (19.6%, a difference of 0.12%), Soviet Union (19.5%, a difference of 0.21%), Jamaican (19.5%, a difference of 0.23%), and Turkish (19.5%, a difference of 0.23%).
| Demographics | Rating | Rank | Female Poverty Among 18-24 Year Olds |
| Immigrants | Canada | 92.9 /100 | #130 | Exceptional 19.5% |
| Latvians | 92.7 /100 | #131 | Exceptional 19.5% |
| Jamaicans | 92.1 /100 | #132 | Exceptional 19.5% |
| Turks | 92.1 /100 | #133 | Exceptional 19.5% |
| Immigrants | North America | 92.1 /100 | #134 | Exceptional 19.5% |
| Soviet Union | 92.0 /100 | #135 | Exceptional 19.5% |
| Russians | 91.5 /100 | #136 | Exceptional 19.5% |
| Austrians | 90.7 /100 | #137 | Exceptional 19.5% |
| Immigrants | Morocco | 89.9 /100 | #138 | Excellent 19.6% |
| Indians (Asian) | 88.3 /100 | #139 | Excellent 19.6% |
| Immigrants | Trinidad and Tobago | 85.6 /100 | #140 | Excellent 19.7% |
| Pennsylvania Germans | 85.5 /100 | #141 | Excellent 19.7% |
| Panamanians | 84.6 /100 | #142 | Excellent 19.7% |
| Slavs | 84.4 /100 | #143 | Excellent 19.7% |
| Immigrants | Northern Africa | 84.1 /100 | #144 | Excellent 19.7% |
Demographics Similar to Immigrants from Jamaica by Female Poverty Among 18-24 Year Olds
In terms of female poverty among 18-24 year olds, the demographic groups most similar to Immigrants from Jamaica are Immigrants from Iraq (18.9%, a difference of 0.010%), Immigrants from Armenia (18.9%, a difference of 0.090%), Burmese (18.9%, a difference of 0.12%), Croatian (19.0%, a difference of 0.15%), and Immigrants from Cabo Verde (19.0%, a difference of 0.17%).
| Demographics | Rating | Rank | Female Poverty Among 18-24 Year Olds |
| Palestinians | 99.5 /100 | #80 | Exceptional 18.8% |
| Japanese | 99.5 /100 | #81 | Exceptional 18.8% |
| Immigrants | Uruguay | 99.4 /100 | #82 | Exceptional 18.8% |
| Immigrants | Indonesia | 99.4 /100 | #83 | Exceptional 18.9% |
| Burmese | 99.2 /100 | #84 | Exceptional 18.9% |
| Immigrants | Armenia | 99.2 /100 | #85 | Exceptional 18.9% |
| Immigrants | Iraq | 99.2 /100 | #86 | Exceptional 18.9% |
| Immigrants | Jamaica | 99.2 /100 | #87 | Exceptional 18.9% |
| Croatians | 99.1 /100 | #88 | Exceptional 19.0% |
| Immigrants | Cabo Verde | 99.0 /100 | #89 | Exceptional 19.0% |
| Afghans | 99.0 /100 | #90 | Exceptional 19.0% |
| Romanians | 98.9 /100 | #91 | Exceptional 19.0% |
| Filipinos | 98.9 /100 | #92 | Exceptional 19.0% |
| Haitians | 98.9 /100 | #93 | Exceptional 19.0% |
| Ukrainians | 98.8 /100 | #94 | Exceptional 19.0% |