Australian vs Sioux Child Poverty Among Boys Under 16
COMPARE
Australian
Sioux
Child Poverty Among Boys Under 16
Child Poverty Among Boys Under 16 Comparison
Australians
Sioux
14.7%
CHILD POVERTY AMONG BOYS UNDER 16
98.0/ 100
METRIC RATING
74th/ 347
METRIC RANK
25.3%
CHILD POVERTY AMONG BOYS UNDER 16
0.0/ 100
METRIC RATING
336th/ 347
METRIC RANK
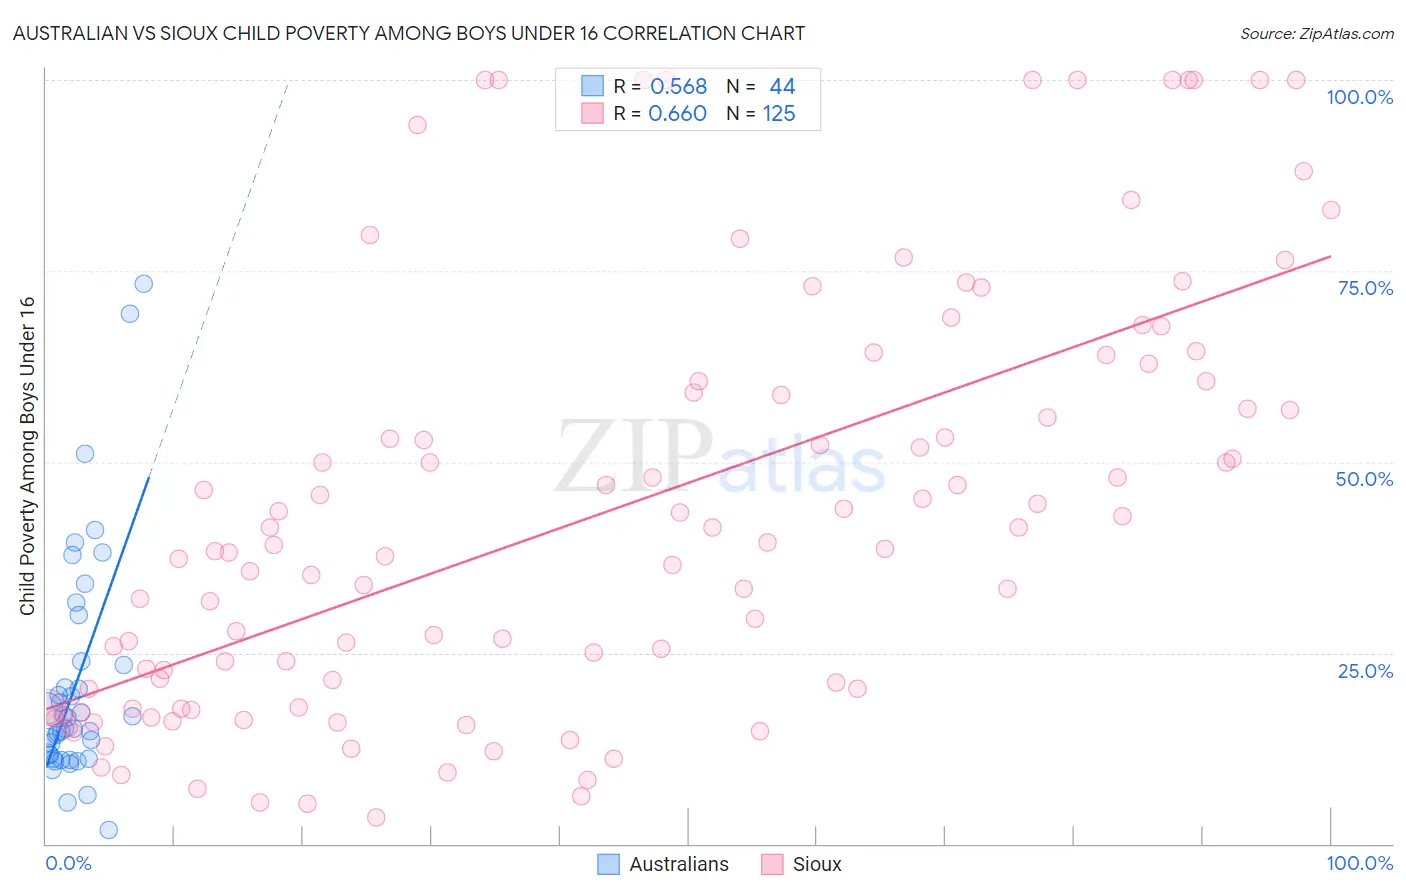
Australian vs Sioux Child Poverty Among Boys Under 16 Correlation Chart
The statistical analysis conducted on geographies consisting of 221,429,706 people shows a substantial positive correlation between the proportion of Australians and poverty level among boys under the age of 16 in the United States with a correlation coefficient (R) of 0.568 and weighted average of 14.7%. Similarly, the statistical analysis conducted on geographies consisting of 232,204,453 people shows a significant positive correlation between the proportion of Sioux and poverty level among boys under the age of 16 in the United States with a correlation coefficient (R) of 0.660 and weighted average of 25.3%, a difference of 72.7%.
Child Poverty Among Boys Under 16 Correlation Summary
| Measurement | Australian | Sioux |
| Minimum | 1.7% | 3.4% |
| Maximum | 73.3% | 100.0% |
| Range | 71.6% | 96.6% |
| Mean | 21.1% | 43.5% |
| Median | 15.8% | 39.1% |
| Interquartile 25% (IQ1) | 11.4% | 19.1% |
| Interquartile 75% (IQ3) | 23.6% | 60.5% |
| Interquartile Range (IQR) | 12.2% | 41.5% |
| Standard Deviation (Sample) | 15.3% | 27.5% |
| Standard Deviation (Population) | 15.1% | 27.4% |
Similar Demographics by Child Poverty Among Boys Under 16
Demographics Similar to Australians by Child Poverty Among Boys Under 16
In terms of child poverty among boys under 16, the demographic groups most similar to Australians are Immigrants from Turkey (14.6%, a difference of 0.050%), Immigrants from Poland (14.7%, a difference of 0.070%), Immigrants from Latvia (14.6%, a difference of 0.10%), Immigrants from Netherlands (14.6%, a difference of 0.11%), and Immigrants from Croatia (14.7%, a difference of 0.13%).
| Demographics | Rating | Rank | Child Poverty Among Boys Under 16 |
| Immigrants | Europe | 98.4 /100 | #67 | Exceptional 14.5% |
| Slovenes | 98.4 /100 | #68 | Exceptional 14.5% |
| Immigrants | Austria | 98.4 /100 | #69 | Exceptional 14.5% |
| Europeans | 98.4 /100 | #70 | Exceptional 14.5% |
| Immigrants | Netherlands | 98.1 /100 | #71 | Exceptional 14.6% |
| Immigrants | Latvia | 98.1 /100 | #72 | Exceptional 14.6% |
| Immigrants | Turkey | 98.0 /100 | #73 | Exceptional 14.6% |
| Australians | 98.0 /100 | #74 | Exceptional 14.7% |
| Immigrants | Poland | 97.9 /100 | #75 | Exceptional 14.7% |
| Immigrants | Croatia | 97.9 /100 | #76 | Exceptional 14.7% |
| Macedonians | 97.9 /100 | #77 | Exceptional 14.7% |
| Egyptians | 97.8 /100 | #78 | Exceptional 14.7% |
| Immigrants | Eastern Europe | 97.8 /100 | #79 | Exceptional 14.7% |
| Immigrants | Russia | 97.7 /100 | #80 | Exceptional 14.7% |
| Immigrants | Canada | 97.6 /100 | #81 | Exceptional 14.7% |
Demographics Similar to Sioux by Child Poverty Among Boys Under 16
In terms of child poverty among boys under 16, the demographic groups most similar to Sioux are Cheyenne (25.8%, a difference of 2.0%), Yup'ik (24.7%, a difference of 2.3%), Hopi (25.9%, a difference of 2.5%), Black/African American (24.5%, a difference of 3.2%), and Apache (24.5%, a difference of 3.3%).
| Demographics | Rating | Rank | Child Poverty Among Boys Under 16 |
| Natives/Alaskans | 0.0 /100 | #329 | Tragic 24.0% |
| Colville | 0.0 /100 | #330 | Tragic 24.1% |
| Dominicans | 0.0 /100 | #331 | Tragic 24.2% |
| Immigrants | Dominican Republic | 0.0 /100 | #332 | Tragic 24.3% |
| Apache | 0.0 /100 | #333 | Tragic 24.5% |
| Blacks/African Americans | 0.0 /100 | #334 | Tragic 24.5% |
| Yup'ik | 0.0 /100 | #335 | Tragic 24.7% |
| Sioux | 0.0 /100 | #336 | Tragic 25.3% |
| Cheyenne | 0.0 /100 | #337 | Tragic 25.8% |
| Hopi | 0.0 /100 | #338 | Tragic 25.9% |
| Houma | 0.0 /100 | #339 | Tragic 26.2% |
| Crow | 0.0 /100 | #340 | Tragic 26.3% |
| Immigrants | Yemen | 0.0 /100 | #341 | Tragic 28.9% |
| Pima | 0.0 /100 | #342 | Tragic 29.7% |
| Navajo | 0.0 /100 | #343 | Tragic 30.3% |