Immigrants from Croatia vs Belgian Child Poverty Under the Age of 16
COMPARE
Immigrants from Croatia
Belgian
Child Poverty Under the Age of 16
Child Poverty Under the Age of 16 Comparison
Immigrants from Croatia
Belgians
14.6%
CHILD POVERTY UNDER THE AGE OF 16
96.1/ 100
METRIC RATING
95th/ 347
METRIC RANK
14.9%
CHILD POVERTY UNDER THE AGE OF 16
93.3/ 100
METRIC RATING
113th/ 347
METRIC RANK
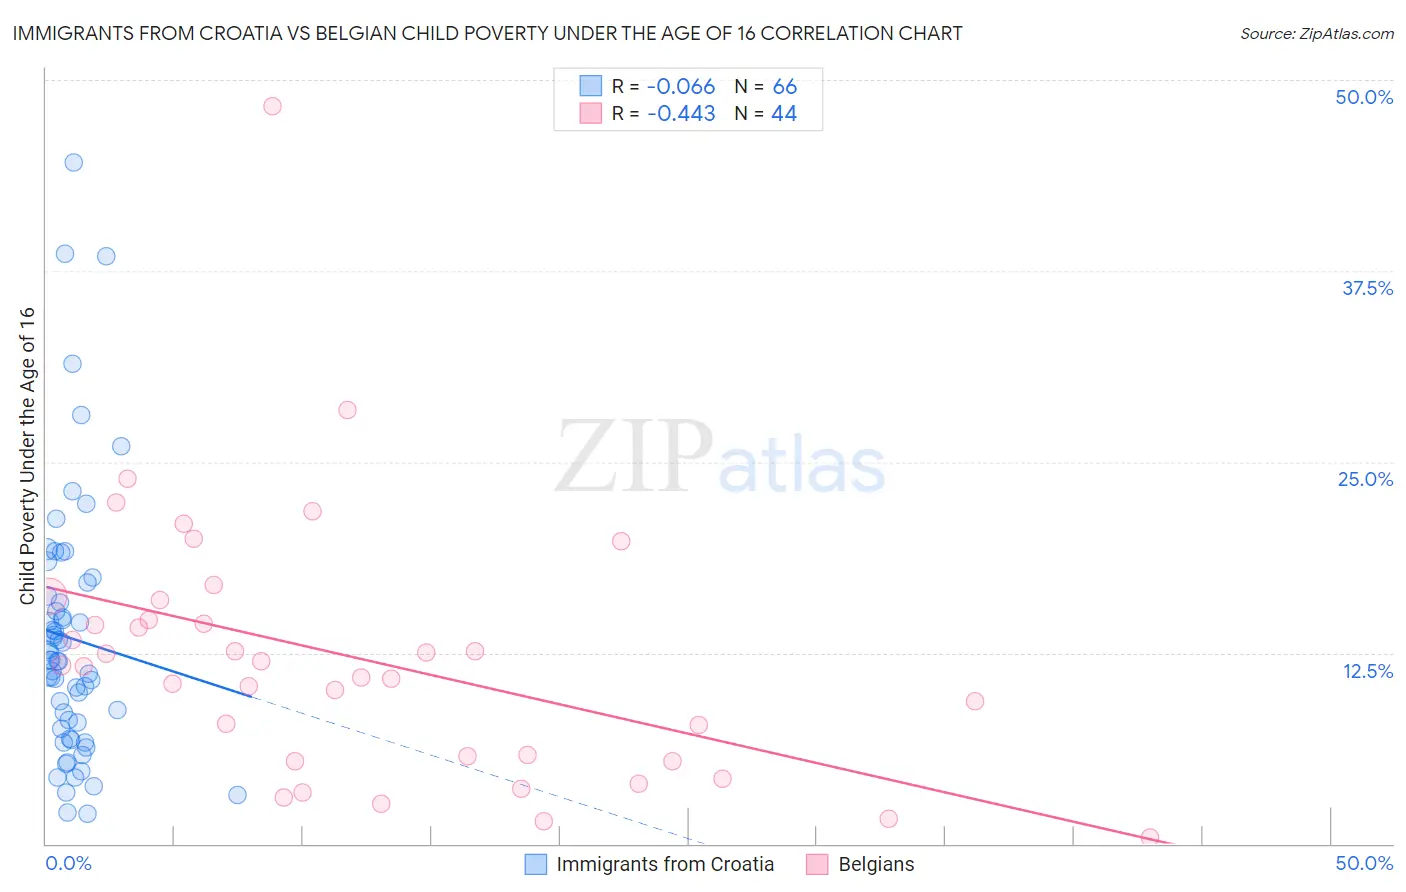
Immigrants from Croatia vs Belgian Child Poverty Under the Age of 16 Correlation Chart
The statistical analysis conducted on geographies consisting of 131,996,138 people shows a slight negative correlation between the proportion of Immigrants from Croatia and poverty level among children under the age of 16 in the United States with a correlation coefficient (R) of -0.066 and weighted average of 14.6%. Similarly, the statistical analysis conducted on geographies consisting of 352,322,898 people shows a moderate negative correlation between the proportion of Belgians and poverty level among children under the age of 16 in the United States with a correlation coefficient (R) of -0.443 and weighted average of 14.9%, a difference of 1.9%.
Child Poverty Under the Age of 16 Correlation Summary
| Measurement | Immigrants from Croatia | Belgian |
| Minimum | 2.0% | 0.43% |
| Maximum | 44.6% | 48.3% |
| Range | 42.7% | 47.9% |
| Mean | 13.5% | 12.2% |
| Median | 12.0% | 11.6% |
| Interquartile 25% (IQ1) | 7.5% | 5.5% |
| Interquartile 75% (IQ3) | 16.2% | 15.3% |
| Interquartile Range (IQR) | 8.7% | 9.8% |
| Standard Deviation (Sample) | 8.6% | 8.7% |
| Standard Deviation (Population) | 8.6% | 8.6% |
Demographics Similar to Immigrants from Croatia and Belgians by Child Poverty Under the Age of 16
In terms of child poverty under the age of 16, the demographic groups most similar to Immigrants from Croatia are Immigrants from South Africa (14.6%, a difference of 0.17%), Immigrants from France (14.7%, a difference of 0.25%), Paraguayan (14.7%, a difference of 0.36%), Immigrants from Belarus (14.7%, a difference of 0.37%), and British (14.7%, a difference of 0.50%). Similarly, the demographic groups most similar to Belgians are Sri Lankan (14.9%, a difference of 0.030%), Irish (14.9%, a difference of 0.040%), Immigrants from Denmark (14.9%, a difference of 0.10%), English (14.9%, a difference of 0.11%), and Tlingit-Haida (14.9%, a difference of 0.45%).
| Demographics | Rating | Rank | Child Poverty Under the Age of 16 |
| Immigrants | South Africa | 96.3 /100 | #94 | Exceptional 14.6% |
| Immigrants | Croatia | 96.1 /100 | #95 | Exceptional 14.6% |
| Immigrants | France | 95.8 /100 | #96 | Exceptional 14.7% |
| Paraguayans | 95.7 /100 | #97 | Exceptional 14.7% |
| Immigrants | Belarus | 95.7 /100 | #98 | Exceptional 14.7% |
| British | 95.5 /100 | #99 | Exceptional 14.7% |
| Dutch | 95.1 /100 | #100 | Exceptional 14.8% |
| Immigrants | Switzerland | 95.1 /100 | #101 | Exceptional 14.8% |
| Romanians | 95.0 /100 | #102 | Exceptional 14.8% |
| Immigrants | Egypt | 94.9 /100 | #103 | Exceptional 14.8% |
| Immigrants | England | 94.8 /100 | #104 | Exceptional 14.8% |
| Basques | 94.7 /100 | #105 | Exceptional 14.8% |
| Serbians | 94.5 /100 | #106 | Exceptional 14.8% |
| Chileans | 94.4 /100 | #107 | Exceptional 14.8% |
| Jordanians | 94.2 /100 | #108 | Exceptional 14.8% |
| Tlingit-Haida | 94.1 /100 | #109 | Exceptional 14.9% |
| English | 93.5 /100 | #110 | Exceptional 14.9% |
| Immigrants | Denmark | 93.5 /100 | #111 | Exceptional 14.9% |
| Irish | 93.4 /100 | #112 | Exceptional 14.9% |
| Belgians | 93.3 /100 | #113 | Exceptional 14.9% |
| Sri Lankans | 93.2 /100 | #114 | Exceptional 14.9% |