Immigrants from South Eastern Asia vs Immigrants from South America Seniors Poverty Over the Age of 65
COMPARE
Immigrants from South Eastern Asia
Immigrants from South America
Seniors Poverty Over the Age of 65
Seniors Poverty Over the Age of 65 Comparison
Immigrants from South Eastern Asia
Immigrants from South America
10.8%
SENIORS POVERTY OVER THE AGE OF 65
62.1/ 100
METRIC RATING
165th/ 347
METRIC RANK
12.7%
SENIORS POVERTY OVER THE AGE OF 65
0.1/ 100
METRIC RATING
270th/ 347
METRIC RANK
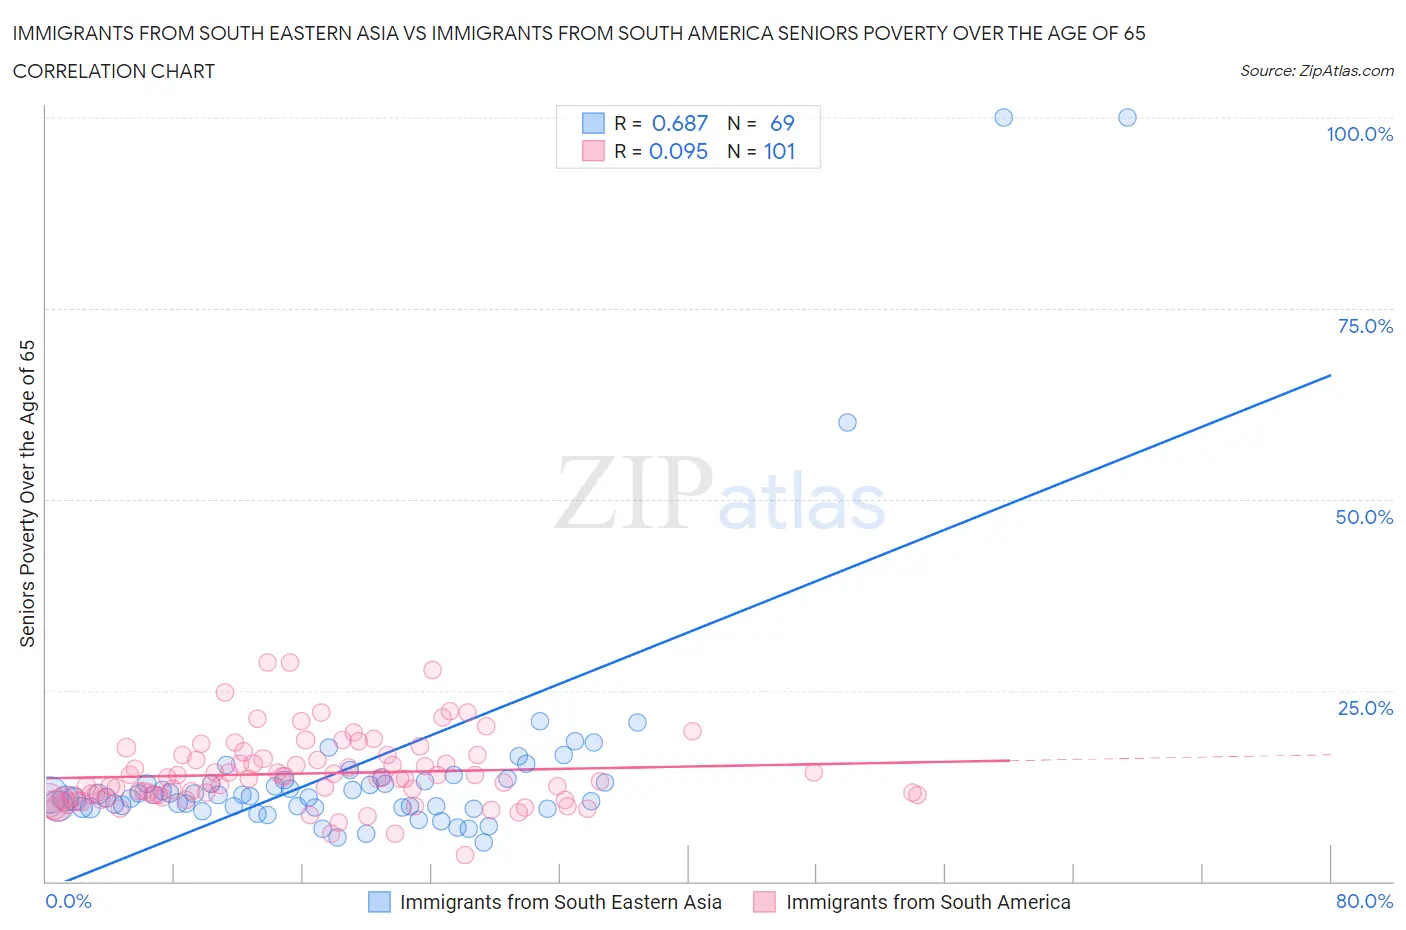
Immigrants from South Eastern Asia vs Immigrants from South America Seniors Poverty Over the Age of 65 Correlation Chart
The statistical analysis conducted on geographies consisting of 509,715,035 people shows a significant positive correlation between the proportion of Immigrants from South Eastern Asia and poverty level among seniors over the age of 65 in the United States with a correlation coefficient (R) of 0.687 and weighted average of 10.8%. Similarly, the statistical analysis conducted on geographies consisting of 483,863,368 people shows a slight positive correlation between the proportion of Immigrants from South America and poverty level among seniors over the age of 65 in the United States with a correlation coefficient (R) of 0.095 and weighted average of 12.7%, a difference of 17.7%.
Seniors Poverty Over the Age of 65 Correlation Summary
| Measurement | Immigrants from South Eastern Asia | Immigrants from South America |
| Minimum | 5.1% | 3.5% |
| Maximum | 100.0% | 28.6% |
| Range | 94.9% | 25.2% |
| Mean | 14.7% | 14.1% |
| Median | 11.2% | 13.5% |
| Interquartile 25% (IQ1) | 9.7% | 11.0% |
| Interquartile 75% (IQ3) | 13.2% | 16.2% |
| Interquartile Range (IQR) | 3.5% | 5.2% |
| Standard Deviation (Sample) | 16.3% | 4.6% |
| Standard Deviation (Population) | 16.2% | 4.6% |
Similar Demographics by Seniors Poverty Over the Age of 65
Demographics Similar to Immigrants from South Eastern Asia by Seniors Poverty Over the Age of 65
In terms of seniors poverty over the age of 65, the demographic groups most similar to Immigrants from South Eastern Asia are Malaysian (10.8%, a difference of 0.010%), Potawatomi (10.8%, a difference of 0.050%), Alaska Native (10.8%, a difference of 0.17%), Tsimshian (10.8%, a difference of 0.23%), and Immigrants from Indonesia (10.8%, a difference of 0.27%).
| Demographics | Rating | Rank | Seniors Poverty Over the Age of 65 |
| Immigrants | Sierra Leone | 71.7 /100 | #158 | Good 10.7% |
| Immigrants | Micronesia | 70.8 /100 | #159 | Good 10.7% |
| Sudanese | 68.2 /100 | #160 | Good 10.7% |
| Arabs | 65.2 /100 | #161 | Good 10.8% |
| Immigrants | Indonesia | 64.8 /100 | #162 | Good 10.8% |
| Tsimshian | 64.5 /100 | #163 | Good 10.8% |
| Potawatomi | 62.6 /100 | #164 | Good 10.8% |
| Immigrants | South Eastern Asia | 62.1 /100 | #165 | Good 10.8% |
| Malaysians | 62.0 /100 | #166 | Good 10.8% |
| Alaska Natives | 60.3 /100 | #167 | Good 10.8% |
| Mongolians | 58.0 /100 | #168 | Average 10.9% |
| Sri Lankans | 56.8 /100 | #169 | Average 10.9% |
| Immigrants | Eastern Europe | 55.8 /100 | #170 | Average 10.9% |
| Immigrants | Nonimmigrants | 55.1 /100 | #171 | Average 10.9% |
| Immigrants | Syria | 54.7 /100 | #172 | Average 10.9% |
Demographics Similar to Immigrants from South America by Seniors Poverty Over the Age of 65
In terms of seniors poverty over the age of 65, the demographic groups most similar to Immigrants from South America are Immigrants from Venezuela (12.7%, a difference of 0.24%), Immigrants from Ghana (12.8%, a difference of 0.27%), Immigrants from Uruguay (12.8%, a difference of 0.30%), Kiowa (12.8%, a difference of 0.42%), and Salvadoran (12.8%, a difference of 0.67%).
| Demographics | Rating | Rank | Seniors Poverty Over the Age of 65 |
| Soviet Union | 0.1 /100 | #263 | Tragic 12.6% |
| Inupiat | 0.1 /100 | #264 | Tragic 12.6% |
| Immigrants | Western Africa | 0.1 /100 | #265 | Tragic 12.6% |
| Africans | 0.1 /100 | #266 | Tragic 12.6% |
| Blackfeet | 0.1 /100 | #267 | Tragic 12.6% |
| Immigrants | Somalia | 0.1 /100 | #268 | Tragic 12.6% |
| Immigrants | Venezuela | 0.1 /100 | #269 | Tragic 12.7% |
| Immigrants | South America | 0.1 /100 | #270 | Tragic 12.7% |
| Immigrants | Ghana | 0.1 /100 | #271 | Tragic 12.8% |
| Immigrants | Uruguay | 0.1 /100 | #272 | Tragic 12.8% |
| Kiowa | 0.0 /100 | #273 | Tragic 12.8% |
| Salvadorans | 0.0 /100 | #274 | Tragic 12.8% |
| Immigrants | Colombia | 0.0 /100 | #275 | Tragic 12.9% |
| Immigrants | Azores | 0.0 /100 | #276 | Tragic 12.9% |
| Paiute | 0.0 /100 | #277 | Tragic 12.9% |