Albanian vs Immigrants from Croatia Female Poverty
COMPARE
Albanian
Immigrants from Croatia
Female Poverty
Female Poverty Comparison
Albanians
Immigrants from Croatia
12.7%
FEMALE POVERTY
90.8/ 100
METRIC RATING
119th/ 347
METRIC RANK
12.0%
FEMALE POVERTY
98.7/ 100
METRIC RATING
52nd/ 347
METRIC RANK
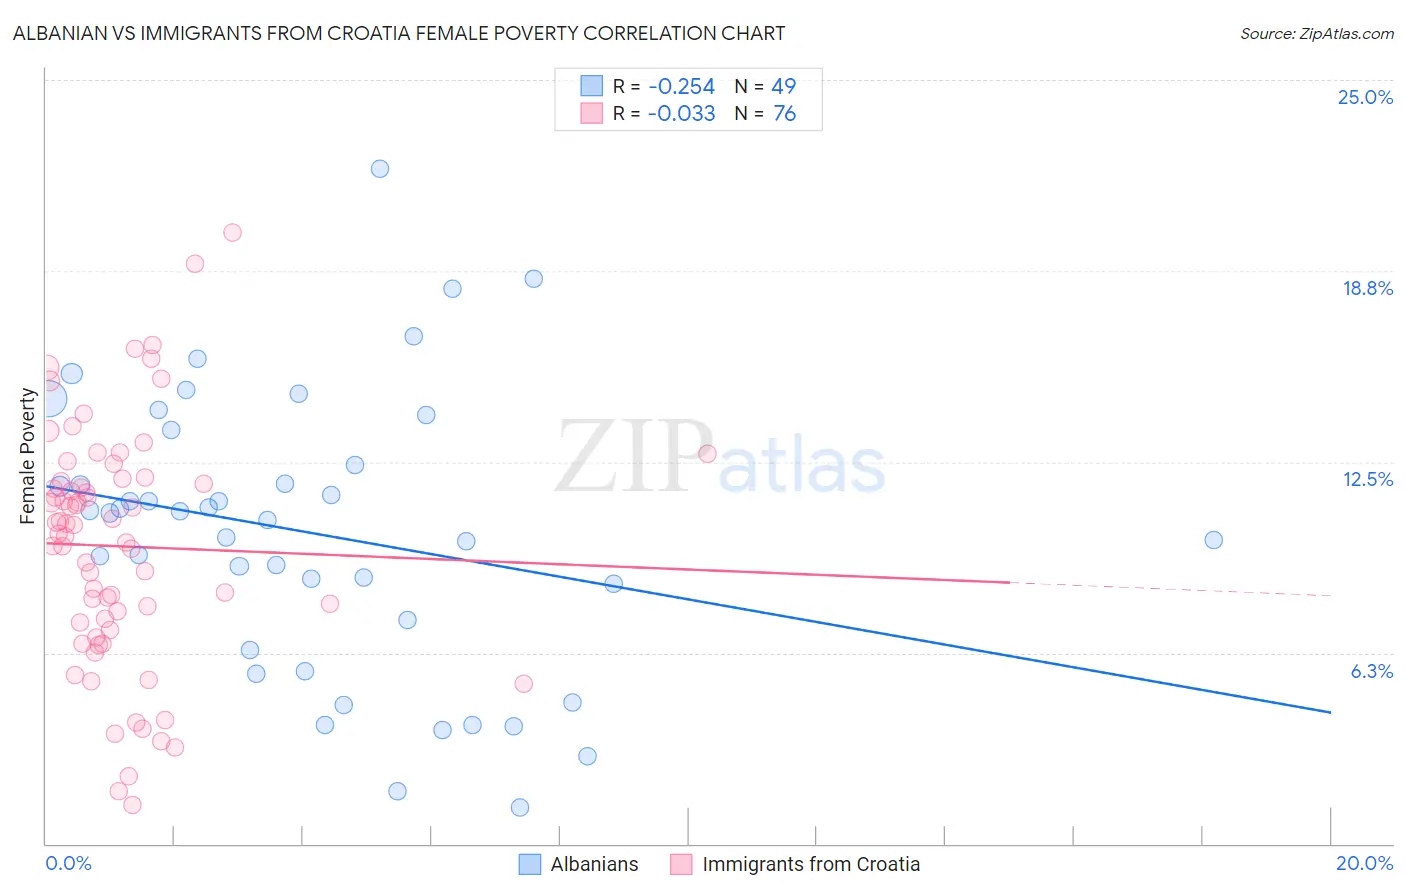
Albanian vs Immigrants from Croatia Female Poverty Correlation Chart
The statistical analysis conducted on geographies consisting of 193,134,120 people shows a weak negative correlation between the proportion of Albanians and poverty level among females in the United States with a correlation coefficient (R) of -0.254 and weighted average of 12.7%. Similarly, the statistical analysis conducted on geographies consisting of 132,555,435 people shows no correlation between the proportion of Immigrants from Croatia and poverty level among females in the United States with a correlation coefficient (R) of -0.033 and weighted average of 12.0%, a difference of 5.5%.
Female Poverty Correlation Summary
| Measurement | Albanian | Immigrants from Croatia |
| Minimum | 1.2% | 1.3% |
| Maximum | 22.1% | 20.0% |
| Range | 20.9% | 18.7% |
| Mean | 10.2% | 9.7% |
| Median | 10.8% | 10.3% |
| Interquartile 25% (IQ1) | 6.8% | 7.1% |
| Interquartile 75% (IQ3) | 13.0% | 11.9% |
| Interquartile Range (IQR) | 6.1% | 4.8% |
| Standard Deviation (Sample) | 4.6% | 3.9% |
| Standard Deviation (Population) | 4.5% | 3.9% |
Similar Demographics by Female Poverty
Demographics Similar to Albanians by Female Poverty
In terms of female poverty, the demographic groups most similar to Albanians are Sri Lankan (12.7%, a difference of 0.010%), Immigrants from Southern Europe (12.7%, a difference of 0.030%), New Zealander (12.7%, a difference of 0.060%), Immigrants from Russia (12.7%, a difference of 0.10%), and Immigrants from Hungary (12.7%, a difference of 0.16%).
| Demographics | Rating | Rank | Female Poverty |
| Immigrants | Israel | 92.0 /100 | #112 | Exceptional 12.6% |
| Canadians | 92.0 /100 | #113 | Exceptional 12.7% |
| Welsh | 91.6 /100 | #114 | Exceptional 12.7% |
| Puget Sound Salish | 91.5 /100 | #115 | Exceptional 12.7% |
| Immigrants | Russia | 91.2 /100 | #116 | Exceptional 12.7% |
| Immigrants | Southern Europe | 90.9 /100 | #117 | Exceptional 12.7% |
| Sri Lankans | 90.9 /100 | #118 | Exceptional 12.7% |
| Albanians | 90.8 /100 | #119 | Exceptional 12.7% |
| New Zealanders | 90.6 /100 | #120 | Exceptional 12.7% |
| Immigrants | Hungary | 90.3 /100 | #121 | Exceptional 12.7% |
| French Canadians | 90.2 /100 | #122 | Exceptional 12.7% |
| Immigrants | South Eastern Asia | 89.9 /100 | #123 | Excellent 12.7% |
| Immigrants | Norway | 89.3 /100 | #124 | Excellent 12.8% |
| Argentineans | 89.1 /100 | #125 | Excellent 12.8% |
| Immigrants | Ukraine | 88.8 /100 | #126 | Excellent 12.8% |
Demographics Similar to Immigrants from Croatia by Female Poverty
In terms of female poverty, the demographic groups most similar to Immigrants from Croatia are Immigrants from Austria (12.0%, a difference of 0.010%), Immigrants from Philippines (12.1%, a difference of 0.15%), Immigrants from Bulgaria (12.0%, a difference of 0.31%), Immigrants from Sri Lanka (12.1%, a difference of 0.50%), and Slovene (12.0%, a difference of 0.52%).
| Demographics | Rating | Rank | Female Poverty |
| Immigrants | Czechoslovakia | 99.2 /100 | #45 | Exceptional 11.9% |
| Turks | 99.2 /100 | #46 | Exceptional 11.9% |
| Asians | 99.1 /100 | #47 | Exceptional 11.9% |
| Immigrants | Japan | 99.0 /100 | #48 | Exceptional 11.9% |
| Immigrants | Romania | 99.0 /100 | #49 | Exceptional 12.0% |
| Slovenes | 98.9 /100 | #50 | Exceptional 12.0% |
| Immigrants | Bulgaria | 98.9 /100 | #51 | Exceptional 12.0% |
| Immigrants | Croatia | 98.7 /100 | #52 | Exceptional 12.0% |
| Immigrants | Austria | 98.7 /100 | #53 | Exceptional 12.0% |
| Immigrants | Philippines | 98.7 /100 | #54 | Exceptional 12.1% |
| Immigrants | Sri Lanka | 98.5 /100 | #55 | Exceptional 12.1% |
| Estonians | 98.3 /100 | #56 | Exceptional 12.1% |
| Immigrants | Serbia | 98.3 /100 | #57 | Exceptional 12.1% |
| Scandinavians | 98.2 /100 | #58 | Exceptional 12.1% |
| Immigrants | Europe | 98.2 /100 | #59 | Exceptional 12.1% |