Albanian vs Sudanese Child Poverty Under the Age of 16
COMPARE
Albanian
Sudanese
Child Poverty Under the Age of 16
Child Poverty Under the Age of 16 Comparison
Albanians
Sudanese
15.2%
CHILD POVERTY UNDER THE AGE OF 16
88.6/ 100
METRIC RATING
135th/ 347
METRIC RANK
18.5%
CHILD POVERTY UNDER THE AGE OF 16
0.9/ 100
METRIC RATING
237th/ 347
METRIC RANK
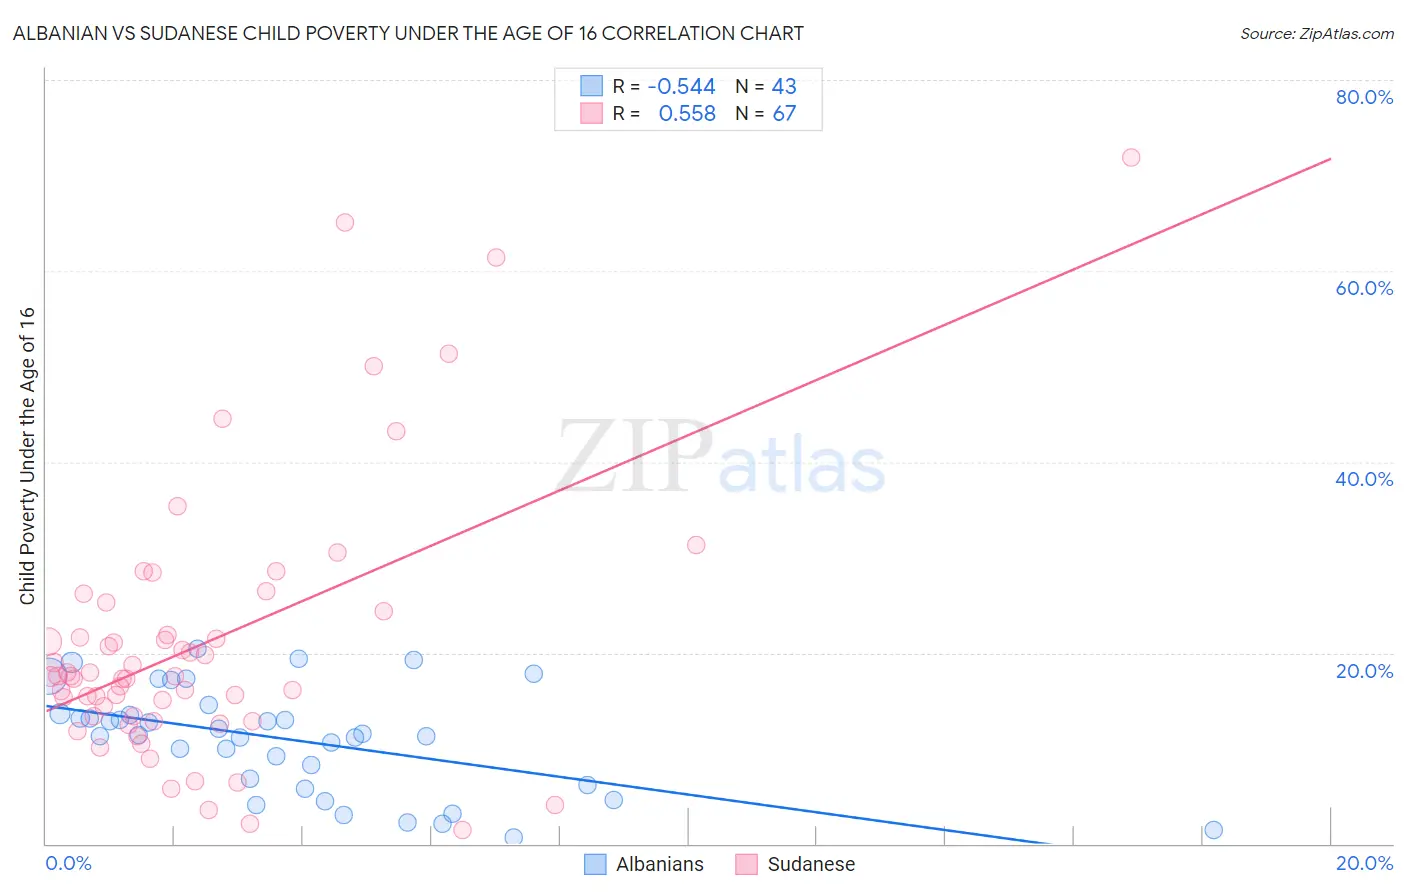
Albanian vs Sudanese Child Poverty Under the Age of 16 Correlation Chart
The statistical analysis conducted on geographies consisting of 191,955,882 people shows a substantial negative correlation between the proportion of Albanians and poverty level among children under the age of 16 in the United States with a correlation coefficient (R) of -0.544 and weighted average of 15.2%. Similarly, the statistical analysis conducted on geographies consisting of 109,977,146 people shows a substantial positive correlation between the proportion of Sudanese and poverty level among children under the age of 16 in the United States with a correlation coefficient (R) of 0.558 and weighted average of 18.5%, a difference of 21.6%.
Child Poverty Under the Age of 16 Correlation Summary
| Measurement | Albanian | Sudanese |
| Minimum | 0.69% | 1.5% |
| Maximum | 20.5% | 71.9% |
| Range | 19.8% | 70.4% |
| Mean | 10.9% | 21.0% |
| Median | 11.4% | 17.5% |
| Interquartile 25% (IQ1) | 6.1% | 13.3% |
| Interquartile 75% (IQ3) | 13.6% | 24.4% |
| Interquartile Range (IQR) | 7.5% | 11.1% |
| Standard Deviation (Sample) | 5.4% | 14.0% |
| Standard Deviation (Population) | 5.4% | 13.9% |
Similar Demographics by Child Poverty Under the Age of 16
Demographics Similar to Albanians by Child Poverty Under the Age of 16
In terms of child poverty under the age of 16, the demographic groups most similar to Albanians are Native Hawaiian (15.2%, a difference of 0.040%), Immigrants from South Eastern Asia (15.2%, a difference of 0.13%), Canadian (15.2%, a difference of 0.18%), Armenian (15.2%, a difference of 0.27%), and Mongolian (15.2%, a difference of 0.30%).
| Demographics | Rating | Rank | Child Poverty Under the Age of 16 |
| Immigrants | Kazakhstan | 90.2 /100 | #128 | Exceptional 15.1% |
| Immigrants | Southern Europe | 89.7 /100 | #129 | Excellent 15.1% |
| Mongolians | 89.5 /100 | #130 | Excellent 15.2% |
| Armenians | 89.4 /100 | #131 | Excellent 15.2% |
| Canadians | 89.1 /100 | #132 | Excellent 15.2% |
| Immigrants | South Eastern Asia | 89.0 /100 | #133 | Excellent 15.2% |
| Native Hawaiians | 88.7 /100 | #134 | Excellent 15.2% |
| Albanians | 88.6 /100 | #135 | Excellent 15.2% |
| Immigrants | Spain | 87.3 /100 | #136 | Excellent 15.3% |
| Peruvians | 87.2 /100 | #137 | Excellent 15.3% |
| Welsh | 87.2 /100 | #138 | Excellent 15.3% |
| Immigrants | Vietnam | 87.1 /100 | #139 | Excellent 15.3% |
| New Zealanders | 86.9 /100 | #140 | Excellent 15.3% |
| Slavs | 84.2 /100 | #141 | Excellent 15.4% |
| Brazilians | 82.8 /100 | #142 | Excellent 15.4% |
Demographics Similar to Sudanese by Child Poverty Under the Age of 16
In terms of child poverty under the age of 16, the demographic groups most similar to Sudanese are Cree (18.5%, a difference of 0.030%), Immigrants from Eritrea (18.5%, a difference of 0.24%), Immigrants from Sudan (18.5%, a difference of 0.28%), Nigerian (18.4%, a difference of 0.32%), and Ghanaian (18.6%, a difference of 0.33%).
| Demographics | Rating | Rank | Child Poverty Under the Age of 16 |
| Nepalese | 1.7 /100 | #230 | Tragic 18.2% |
| Nicaraguans | 1.7 /100 | #231 | Tragic 18.2% |
| Americans | 1.2 /100 | #232 | Tragic 18.3% |
| Fijians | 1.1 /100 | #233 | Tragic 18.4% |
| Immigrants | Nigeria | 1.0 /100 | #234 | Tragic 18.4% |
| Nigerians | 1.0 /100 | #235 | Tragic 18.4% |
| Cree | 0.9 /100 | #236 | Tragic 18.5% |
| Sudanese | 0.9 /100 | #237 | Tragic 18.5% |
| Immigrants | Eritrea | 0.8 /100 | #238 | Tragic 18.5% |
| Immigrants | Sudan | 0.8 /100 | #239 | Tragic 18.5% |
| Ghanaians | 0.8 /100 | #240 | Tragic 18.6% |
| Alsatians | 0.7 /100 | #241 | Tragic 18.6% |
| Immigrants | Laos | 0.6 /100 | #242 | Tragic 18.7% |
| Immigrants | Cuba | 0.6 /100 | #243 | Tragic 18.7% |
| Cape Verdeans | 0.6 /100 | #244 | Tragic 18.7% |