Immigrants from Albania vs British West Indian Child Poverty Under the Age of 16
COMPARE
Immigrants from Albania
British West Indian
Child Poverty Under the Age of 16
Child Poverty Under the Age of 16 Comparison
Immigrants from Albania
British West Indians
15.8%
CHILD POVERTY UNDER THE AGE OF 16
70.7/ 100
METRIC RATING
160th/ 347
METRIC RANK
21.3%
CHILD POVERTY UNDER THE AGE OF 16
0.0/ 100
METRIC RATING
308th/ 347
METRIC RANK
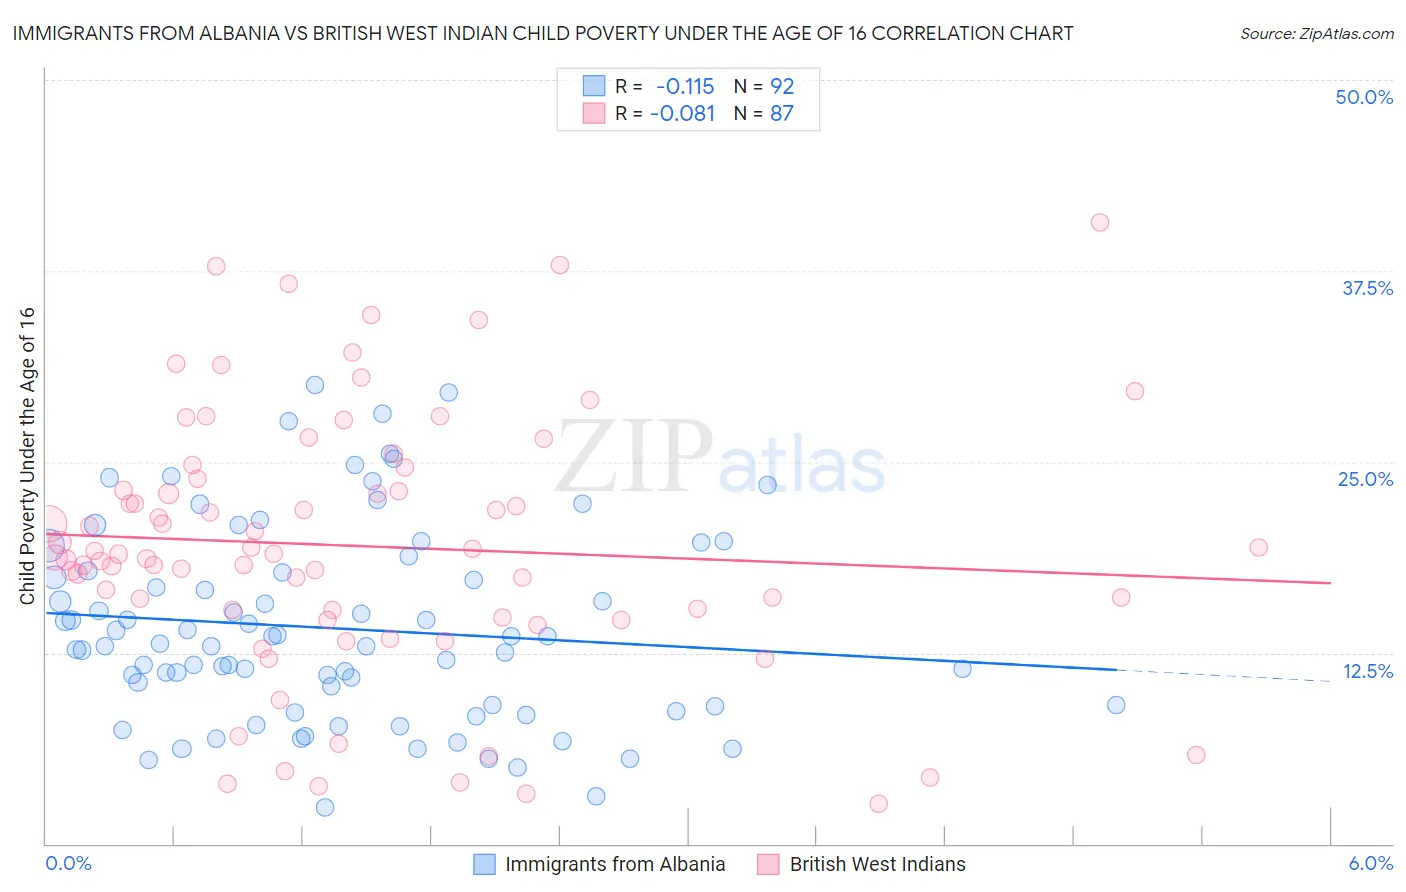
Immigrants from Albania vs British West Indian Child Poverty Under the Age of 16 Correlation Chart
The statistical analysis conducted on geographies consisting of 118,988,318 people shows a poor negative correlation between the proportion of Immigrants from Albania and poverty level among children under the age of 16 in the United States with a correlation coefficient (R) of -0.115 and weighted average of 15.8%. Similarly, the statistical analysis conducted on geographies consisting of 152,192,070 people shows a slight negative correlation between the proportion of British West Indians and poverty level among children under the age of 16 in the United States with a correlation coefficient (R) of -0.081 and weighted average of 21.3%, a difference of 35.1%.
Child Poverty Under the Age of 16 Correlation Summary
| Measurement | Immigrants from Albania | British West Indian |
| Minimum | 2.3% | 2.6% |
| Maximum | 30.0% | 40.6% |
| Range | 27.7% | 38.1% |
| Mean | 14.1% | 19.5% |
| Median | 13.0% | 19.0% |
| Interquartile 25% (IQ1) | 9.1% | 14.8% |
| Interquartile 75% (IQ3) | 17.8% | 23.9% |
| Interquartile Range (IQR) | 8.8% | 9.1% |
| Standard Deviation (Sample) | 6.4% | 8.5% |
| Standard Deviation (Population) | 6.3% | 8.5% |
Similar Demographics by Child Poverty Under the Age of 16
Demographics Similar to Immigrants from Albania by Child Poverty Under the Age of 16
In terms of child poverty under the age of 16, the demographic groups most similar to Immigrants from Albania are Immigrants from Fiji (15.8%, a difference of 0.070%), Immigrants from Chile (15.7%, a difference of 0.32%), Immigrants from Nepal (15.7%, a difference of 0.34%), Immigrants from Northern Africa (15.8%, a difference of 0.38%), and Colombian (15.8%, a difference of 0.44%).
| Demographics | Rating | Rank | Child Poverty Under the Age of 16 |
| Venezuelans | 77.4 /100 | #153 | Good 15.6% |
| Samoans | 77.3 /100 | #154 | Good 15.6% |
| Syrians | 76.1 /100 | #155 | Good 15.6% |
| Immigrants | Venezuela | 74.9 /100 | #156 | Good 15.7% |
| Immigrants | Nepal | 72.9 /100 | #157 | Good 15.7% |
| Immigrants | Chile | 72.8 /100 | #158 | Good 15.7% |
| Immigrants | Fiji | 71.1 /100 | #159 | Good 15.8% |
| Immigrants | Albania | 70.7 /100 | #160 | Good 15.8% |
| Immigrants | Northern Africa | 68.1 /100 | #161 | Good 15.8% |
| Colombians | 67.6 /100 | #162 | Good 15.8% |
| Yugoslavians | 67.6 /100 | #163 | Good 15.8% |
| Immigrants | Germany | 67.3 /100 | #164 | Good 15.8% |
| Guamanians/Chamorros | 66.4 /100 | #165 | Good 15.9% |
| Immigrants | Oceania | 65.4 /100 | #166 | Good 15.9% |
| Costa Ricans | 61.1 /100 | #167 | Good 16.0% |
Demographics Similar to British West Indians by Child Poverty Under the Age of 16
In terms of child poverty under the age of 16, the demographic groups most similar to British West Indians are Immigrants from Central America (21.3%, a difference of 0.29%), Immigrants from Mexico (21.5%, a difference of 0.65%), Bahamian (21.5%, a difference of 0.67%), Guatemalan (21.2%, a difference of 0.70%), and Dutch West Indian (21.5%, a difference of 0.76%).
| Demographics | Rating | Rank | Child Poverty Under the Age of 16 |
| Immigrants | Grenada | 0.0 /100 | #301 | Tragic 21.0% |
| Immigrants | Bahamas | 0.0 /100 | #302 | Tragic 21.0% |
| Choctaw | 0.0 /100 | #303 | Tragic 21.0% |
| Somalis | 0.0 /100 | #304 | Tragic 21.0% |
| Seminole | 0.0 /100 | #305 | Tragic 21.1% |
| Guatemalans | 0.0 /100 | #306 | Tragic 21.2% |
| Immigrants | Central America | 0.0 /100 | #307 | Tragic 21.3% |
| British West Indians | 0.0 /100 | #308 | Tragic 21.3% |
| Immigrants | Mexico | 0.0 /100 | #309 | Tragic 21.5% |
| Bahamians | 0.0 /100 | #310 | Tragic 21.5% |
| Dutch West Indians | 0.0 /100 | #311 | Tragic 21.5% |
| Ute | 0.0 /100 | #312 | Tragic 21.5% |
| Creek | 0.0 /100 | #313 | Tragic 21.5% |
| Immigrants | Somalia | 0.0 /100 | #314 | Tragic 21.6% |
| Immigrants | Guatemala | 0.0 /100 | #315 | Tragic 21.6% |