Guyanese vs Immigrants from Spain Female Poverty Among 25-34 Year Olds
COMPARE
Guyanese
Immigrants from Spain
Female Poverty Among 25-34 Year Olds
Female Poverty Among 25-34 Year Olds Comparison
Guyanese
Immigrants from Spain
14.2%
FEMALE POVERTY AMONG 25-34 YEAR OLDS
8.6/ 100
METRIC RATING
209th/ 347
METRIC RANK
12.7%
FEMALE POVERTY AMONG 25-34 YEAR OLDS
95.5/ 100
METRIC RATING
103rd/ 347
METRIC RANK
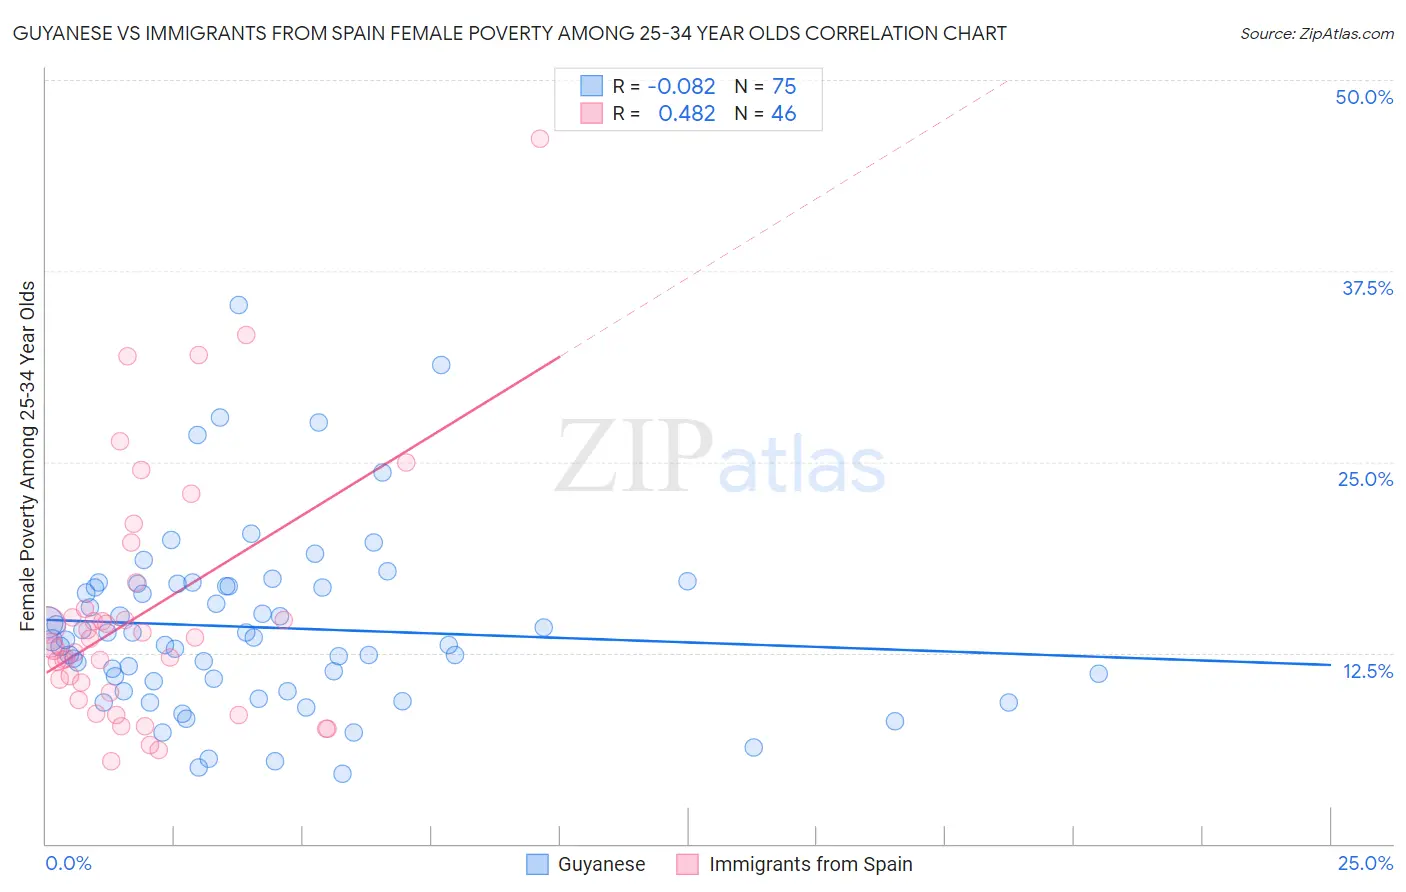
Guyanese vs Immigrants from Spain Female Poverty Among 25-34 Year Olds Correlation Chart
The statistical analysis conducted on geographies consisting of 175,220,528 people shows a slight negative correlation between the proportion of Guyanese and poverty level among females between the ages 25 and 34 in the United States with a correlation coefficient (R) of -0.082 and weighted average of 14.2%. Similarly, the statistical analysis conducted on geographies consisting of 237,358,886 people shows a moderate positive correlation between the proportion of Immigrants from Spain and poverty level among females between the ages 25 and 34 in the United States with a correlation coefficient (R) of 0.482 and weighted average of 12.7%, a difference of 12.0%.
Female Poverty Among 25-34 Year Olds Correlation Summary
| Measurement | Guyanese | Immigrants from Spain |
| Minimum | 4.6% | 5.4% |
| Maximum | 35.3% | 46.2% |
| Range | 30.7% | 40.7% |
| Mean | 14.2% | 15.1% |
| Median | 13.4% | 13.2% |
| Interquartile 25% (IQ1) | 10.7% | 9.9% |
| Interquartile 75% (IQ3) | 16.8% | 15.4% |
| Interquartile Range (IQR) | 6.2% | 5.5% |
| Standard Deviation (Sample) | 5.8% | 8.3% |
| Standard Deviation (Population) | 5.8% | 8.2% |
Similar Demographics by Female Poverty Among 25-34 Year Olds
Demographics Similar to Guyanese by Female Poverty Among 25-34 Year Olds
In terms of female poverty among 25-34 year olds, the demographic groups most similar to Guyanese are Panamanian (14.2%, a difference of 0.010%), Trinidadian and Tobagonian (14.2%, a difference of 0.12%), Immigrants from Guyana (14.3%, a difference of 0.57%), Puget Sound Salish (14.3%, a difference of 0.60%), and Immigrants from Panama (14.1%, a difference of 0.66%).
| Demographics | Rating | Rank | Female Poverty Among 25-34 Year Olds |
| Welsh | 17.2 /100 | #202 | Poor 14.0% |
| Immigrants | Immigrants | 14.5 /100 | #203 | Poor 14.0% |
| Hawaiians | 13.6 /100 | #204 | Poor 14.1% |
| Immigrants | Africa | 13.4 /100 | #205 | Poor 14.1% |
| Hungarians | 11.8 /100 | #206 | Poor 14.1% |
| Japanese | 11.7 /100 | #207 | Poor 14.1% |
| Immigrants | Panama | 11.6 /100 | #208 | Poor 14.1% |
| Guyanese | 8.6 /100 | #209 | Tragic 14.2% |
| Panamanians | 8.6 /100 | #210 | Tragic 14.2% |
| Trinidadians and Tobagonians | 8.2 /100 | #211 | Tragic 14.2% |
| Immigrants | Guyana | 6.6 /100 | #212 | Tragic 14.3% |
| Puget Sound Salish | 6.5 /100 | #213 | Tragic 14.3% |
| French | 6.2 /100 | #214 | Tragic 14.3% |
| Immigrants | Nigeria | 6.2 /100 | #215 | Tragic 14.3% |
| French Canadians | 5.5 /100 | #216 | Tragic 14.3% |
Demographics Similar to Immigrants from Spain by Female Poverty Among 25-34 Year Olds
In terms of female poverty among 25-34 year olds, the demographic groups most similar to Immigrants from Spain are Swedish (12.7%, a difference of 0.050%), Peruvian (12.7%, a difference of 0.060%), Immigrants from South Africa (12.7%, a difference of 0.090%), Immigrants from Switzerland (12.7%, a difference of 0.12%), and Immigrants from Denmark (12.7%, a difference of 0.14%).
| Demographics | Rating | Rank | Female Poverty Among 25-34 Year Olds |
| Immigrants | Zimbabwe | 96.7 /100 | #96 | Exceptional 12.6% |
| Immigrants | Northern Africa | 96.6 /100 | #97 | Exceptional 12.6% |
| Immigrants | Ethiopia | 96.5 /100 | #98 | Exceptional 12.6% |
| Immigrants | Argentina | 96.4 /100 | #99 | Exceptional 12.6% |
| Immigrants | Denmark | 95.7 /100 | #100 | Exceptional 12.7% |
| Immigrants | Switzerland | 95.7 /100 | #101 | Exceptional 12.7% |
| Peruvians | 95.6 /100 | #102 | Exceptional 12.7% |
| Immigrants | Spain | 95.5 /100 | #103 | Exceptional 12.7% |
| Swedes | 95.4 /100 | #104 | Exceptional 12.7% |
| Immigrants | South Africa | 95.3 /100 | #105 | Exceptional 12.7% |
| Tsimshian | 95.1 /100 | #106 | Exceptional 12.7% |
| Poles | 94.9 /100 | #107 | Exceptional 12.7% |
| Immigrants | Norway | 94.4 /100 | #108 | Exceptional 12.7% |
| Immigrants | Peru | 94.3 /100 | #109 | Exceptional 12.7% |
| Australians | 94.1 /100 | #110 | Exceptional 12.8% |