Afghan vs Immigrants from Northern Europe Female Poverty Among 25-34 Year Olds
COMPARE
Afghan
Immigrants from Northern Europe
Female Poverty Among 25-34 Year Olds
Female Poverty Among 25-34 Year Olds Comparison
Afghans
Immigrants from Northern Europe
13.0%
FEMALE POVERTY AMONG 25-34 YEAR OLDS
85.8/ 100
METRIC RATING
134th/ 347
METRIC RANK
12.1%
FEMALE POVERTY AMONG 25-34 YEAR OLDS
99.4/ 100
METRIC RATING
60th/ 347
METRIC RANK
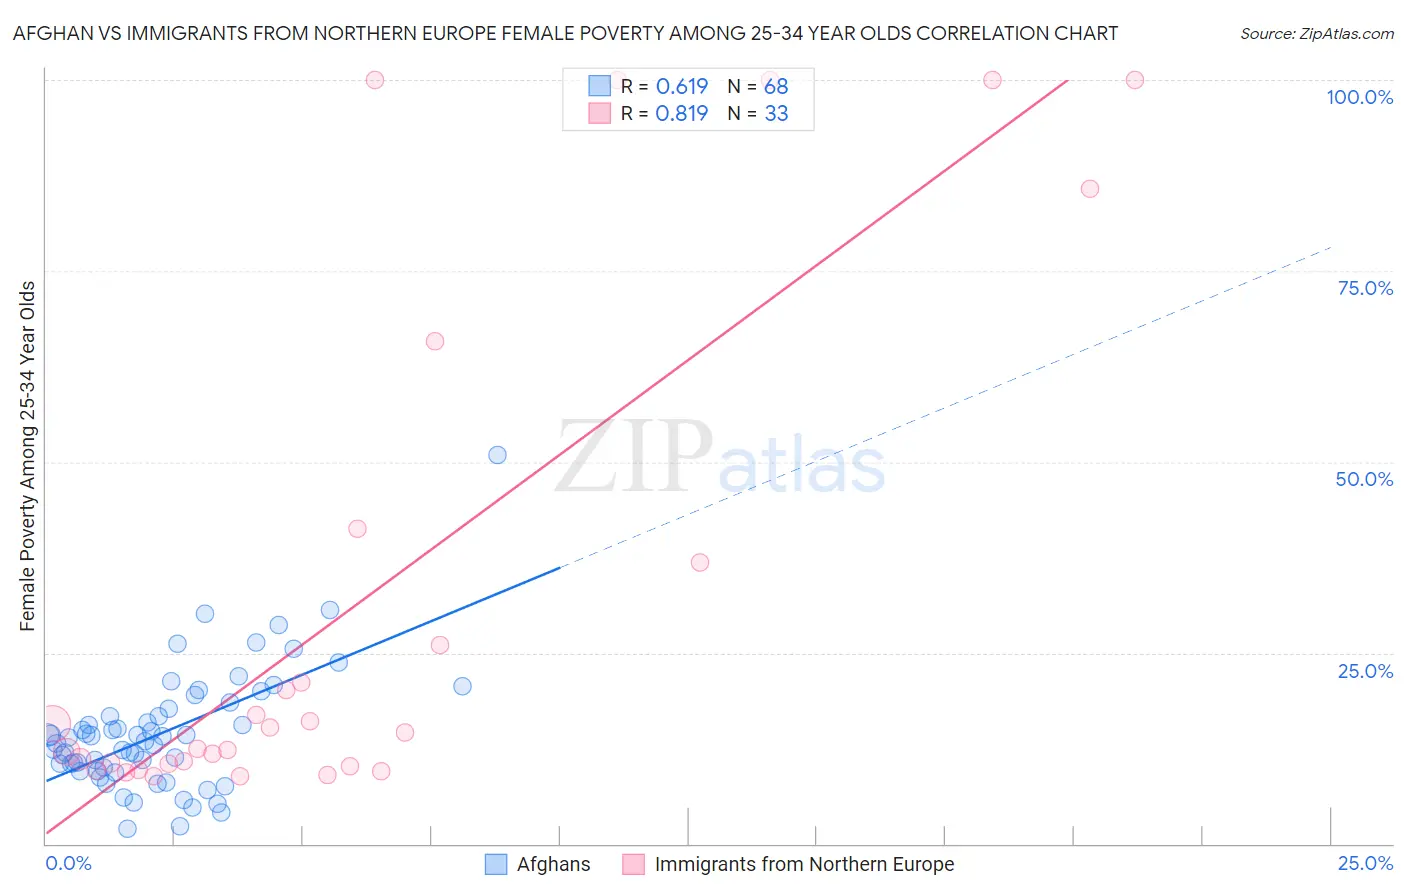
Afghan vs Immigrants from Northern Europe Female Poverty Among 25-34 Year Olds Correlation Chart
The statistical analysis conducted on geographies consisting of 147,945,661 people shows a significant positive correlation between the proportion of Afghans and poverty level among females between the ages 25 and 34 in the United States with a correlation coefficient (R) of 0.619 and weighted average of 13.0%. Similarly, the statistical analysis conducted on geographies consisting of 464,819,833 people shows a very strong positive correlation between the proportion of Immigrants from Northern Europe and poverty level among females between the ages 25 and 34 in the United States with a correlation coefficient (R) of 0.819 and weighted average of 12.1%, a difference of 7.6%.
Female Poverty Among 25-34 Year Olds Correlation Summary
| Measurement | Afghan | Immigrants from Northern Europe |
| Minimum | 2.0% | 8.8% |
| Maximum | 50.9% | 100.0% |
| Range | 48.9% | 91.2% |
| Mean | 14.5% | 31.6% |
| Median | 13.6% | 14.5% |
| Interquartile 25% (IQ1) | 9.8% | 10.3% |
| Interquartile 75% (IQ3) | 17.2% | 39.0% |
| Interquartile Range (IQR) | 7.5% | 28.7% |
| Standard Deviation (Sample) | 7.9% | 33.7% |
| Standard Deviation (Population) | 7.8% | 33.2% |
Similar Demographics by Female Poverty Among 25-34 Year Olds
Demographics Similar to Afghans by Female Poverty Among 25-34 Year Olds
In terms of female poverty among 25-34 year olds, the demographic groups most similar to Afghans are South African (13.0%, a difference of 0.020%), Immigrants from England (13.0%, a difference of 0.040%), Immigrants from Chile (13.1%, a difference of 0.20%), Brazilian (13.1%, a difference of 0.22%), and Austrian (13.1%, a difference of 0.34%).
| Demographics | Rating | Rank | Female Poverty Among 25-34 Year Olds |
| Czechs | 90.3 /100 | #127 | Exceptional 12.9% |
| Syrians | 90.2 /100 | #128 | Exceptional 12.9% |
| Immigrants | North America | 89.7 /100 | #129 | Excellent 12.9% |
| Immigrants | Uzbekistan | 89.6 /100 | #130 | Excellent 12.9% |
| Pakistanis | 88.4 /100 | #131 | Excellent 13.0% |
| Immigrants | Hungary | 88.3 /100 | #132 | Excellent 13.0% |
| Serbians | 87.6 /100 | #133 | Excellent 13.0% |
| Afghans | 85.8 /100 | #134 | Excellent 13.0% |
| South Africans | 85.7 /100 | #135 | Excellent 13.0% |
| Immigrants | England | 85.5 /100 | #136 | Excellent 13.0% |
| Immigrants | Chile | 84.6 /100 | #137 | Excellent 13.1% |
| Brazilians | 84.5 /100 | #138 | Excellent 13.1% |
| Austrians | 83.7 /100 | #139 | Excellent 13.1% |
| Immigrants | Iraq | 83.6 /100 | #140 | Excellent 13.1% |
| New Zealanders | 83.4 /100 | #141 | Excellent 13.1% |
Demographics Similar to Immigrants from Northern Europe by Female Poverty Among 25-34 Year Olds
In terms of female poverty among 25-34 year olds, the demographic groups most similar to Immigrants from Northern Europe are Immigrants from Czechoslovakia (12.1%, a difference of 0.020%), Immigrants from Romania (12.1%, a difference of 0.090%), Russian (12.1%, a difference of 0.090%), Immigrants from Moldova (12.1%, a difference of 0.19%), and Soviet Union (12.1%, a difference of 0.21%).
| Demographics | Rating | Rank | Female Poverty Among 25-34 Year Olds |
| Immigrants | Israel | 99.6 /100 | #53 | Exceptional 12.0% |
| Eastern Europeans | 99.6 /100 | #54 | Exceptional 12.0% |
| Immigrants | Philippines | 99.5 /100 | #55 | Exceptional 12.0% |
| Luxembourgers | 99.5 /100 | #56 | Exceptional 12.1% |
| Jordanians | 99.4 /100 | #57 | Exceptional 12.1% |
| Immigrants | Romania | 99.4 /100 | #58 | Exceptional 12.1% |
| Russians | 99.4 /100 | #59 | Exceptional 12.1% |
| Immigrants | Northern Europe | 99.4 /100 | #60 | Exceptional 12.1% |
| Immigrants | Czechoslovakia | 99.4 /100 | #61 | Exceptional 12.1% |
| Immigrants | Moldova | 99.3 /100 | #62 | Exceptional 12.1% |
| Soviet Union | 99.3 /100 | #63 | Exceptional 12.1% |
| Immigrants | Russia | 99.2 /100 | #64 | Exceptional 12.2% |
| Armenians | 99.2 /100 | #65 | Exceptional 12.2% |
| Immigrants | Europe | 99.2 /100 | #66 | Exceptional 12.2% |
| Laotians | 99.2 /100 | #67 | Exceptional 12.2% |