Spaniard vs Palestinian In Labor Force | Age 45-54
COMPARE
Spaniard
Palestinian
In Labor Force | Age 45-54
In Labor Force | Age 45-54 Comparison
Spaniards
Palestinians
81.5%
IN LABOR FORCE | AGE 45-54
0.1/ 100
METRIC RATING
260th/ 347
METRIC RANK
83.3%
IN LABOR FORCE | AGE 45-54
94.8/ 100
METRIC RATING
97th/ 347
METRIC RANK
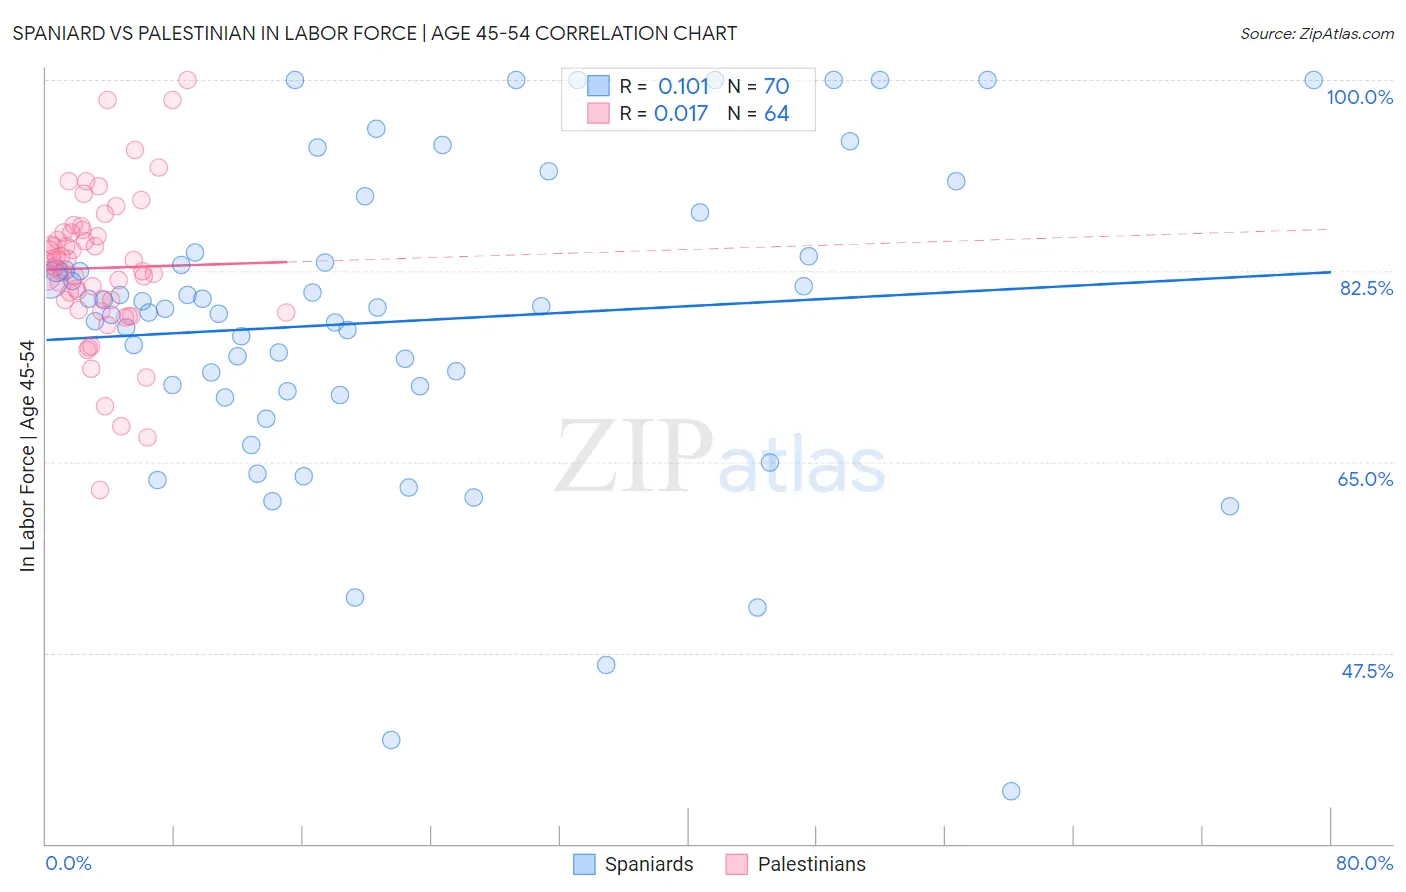
Spaniard vs Palestinian In Labor Force | Age 45-54 Correlation Chart
The statistical analysis conducted on geographies consisting of 443,105,188 people shows a poor positive correlation between the proportion of Spaniards and labor force participation rate among population between the ages 45 and 54 in the United States with a correlation coefficient (R) of 0.101 and weighted average of 81.5%. Similarly, the statistical analysis conducted on geographies consisting of 216,394,682 people shows no correlation between the proportion of Palestinians and labor force participation rate among population between the ages 45 and 54 in the United States with a correlation coefficient (R) of 0.017 and weighted average of 83.3%, a difference of 2.2%.
In Labor Force | Age 45-54 Correlation Summary
| Measurement | Spaniard | Palestinian |
| Minimum | 34.8% | 62.4% |
| Maximum | 100.0% | 100.0% |
| Range | 65.2% | 37.6% |
| Mean | 77.9% | 82.8% |
| Median | 79.1% | 82.9% |
| Interquartile 25% (IQ1) | 71.5% | 79.4% |
| Interquartile 75% (IQ3) | 83.8% | 86.0% |
| Interquartile Range (IQR) | 12.3% | 6.7% |
| Standard Deviation (Sample) | 14.2% | 6.9% |
| Standard Deviation (Population) | 14.1% | 6.8% |
Similar Demographics by In Labor Force | Age 45-54
Demographics Similar to Spaniards by In Labor Force | Age 45-54
In terms of in labor force | age 45-54, the demographic groups most similar to Spaniards are Hawaiian (81.5%, a difference of 0.020%), Immigrants from Guyana (81.5%, a difference of 0.020%), Immigrants from Fiji (81.5%, a difference of 0.030%), Guyanese (81.5%, a difference of 0.030%), and Indonesian (81.5%, a difference of 0.030%).
| Demographics | Rating | Rank | In Labor Force | Age 45-54 |
| Japanese | 0.2 /100 | #253 | Tragic 81.6% |
| Immigrants | Laos | 0.2 /100 | #254 | Tragic 81.6% |
| Scotch-Irish | 0.2 /100 | #255 | Tragic 81.6% |
| Barbadians | 0.1 /100 | #256 | Tragic 81.6% |
| Immigrants | Congo | 0.1 /100 | #257 | Tragic 81.6% |
| Immigrants | Fiji | 0.1 /100 | #258 | Tragic 81.5% |
| Guyanese | 0.1 /100 | #259 | Tragic 81.5% |
| Spaniards | 0.1 /100 | #260 | Tragic 81.5% |
| Hawaiians | 0.1 /100 | #261 | Tragic 81.5% |
| Immigrants | Guyana | 0.1 /100 | #262 | Tragic 81.5% |
| Indonesians | 0.1 /100 | #263 | Tragic 81.5% |
| Immigrants | West Indies | 0.1 /100 | #264 | Tragic 81.5% |
| Hondurans | 0.1 /100 | #265 | Tragic 81.4% |
| Immigrants | St. Vincent and the Grenadines | 0.1 /100 | #266 | Tragic 81.4% |
| West Indians | 0.1 /100 | #267 | Tragic 81.4% |
Demographics Similar to Palestinians by In Labor Force | Age 45-54
In terms of in labor force | age 45-54, the demographic groups most similar to Palestinians are Immigrants from Argentina (83.3%, a difference of 0.0%), Immigrants from Kuwait (83.3%, a difference of 0.0%), Argentinean (83.3%, a difference of 0.010%), Maltese (83.3%, a difference of 0.010%), and Danish (83.3%, a difference of 0.020%).
| Demographics | Rating | Rank | In Labor Force | Age 45-54 |
| Immigrants | Japan | 95.5 /100 | #90 | Exceptional 83.3% |
| South Americans | 95.5 /100 | #91 | Exceptional 83.3% |
| Danes | 95.3 /100 | #92 | Exceptional 83.3% |
| Italians | 95.1 /100 | #93 | Exceptional 83.3% |
| Argentineans | 94.9 /100 | #94 | Exceptional 83.3% |
| Immigrants | Argentina | 94.9 /100 | #95 | Exceptional 83.3% |
| Immigrants | Kuwait | 94.8 /100 | #96 | Exceptional 83.3% |
| Palestinians | 94.8 /100 | #97 | Exceptional 83.3% |
| Maltese | 94.4 /100 | #98 | Exceptional 83.3% |
| Immigrants | Middle Africa | 94.3 /100 | #99 | Exceptional 83.3% |
| Mongolians | 94.2 /100 | #100 | Exceptional 83.3% |
| Immigrants | Belarus | 94.1 /100 | #101 | Exceptional 83.3% |
| Immigrants | Singapore | 93.9 /100 | #102 | Exceptional 83.3% |
| Albanians | 93.9 /100 | #103 | Exceptional 83.3% |
| Immigrants | Romania | 93.8 /100 | #104 | Exceptional 83.3% |