Yaqui vs Immigrants from Iran In Labor Force | Age 30-34
COMPARE
Yaqui
Immigrants from Iran
In Labor Force | Age 30-34
In Labor Force | Age 30-34 Comparison
Yaqui
Immigrants from Iran
81.4%
IN LABOR FORCE | AGE 30-34
0.0/ 100
METRIC RATING
320th/ 347
METRIC RANK
85.4%
IN LABOR FORCE | AGE 30-34
99.2/ 100
METRIC RATING
69th/ 347
METRIC RANK
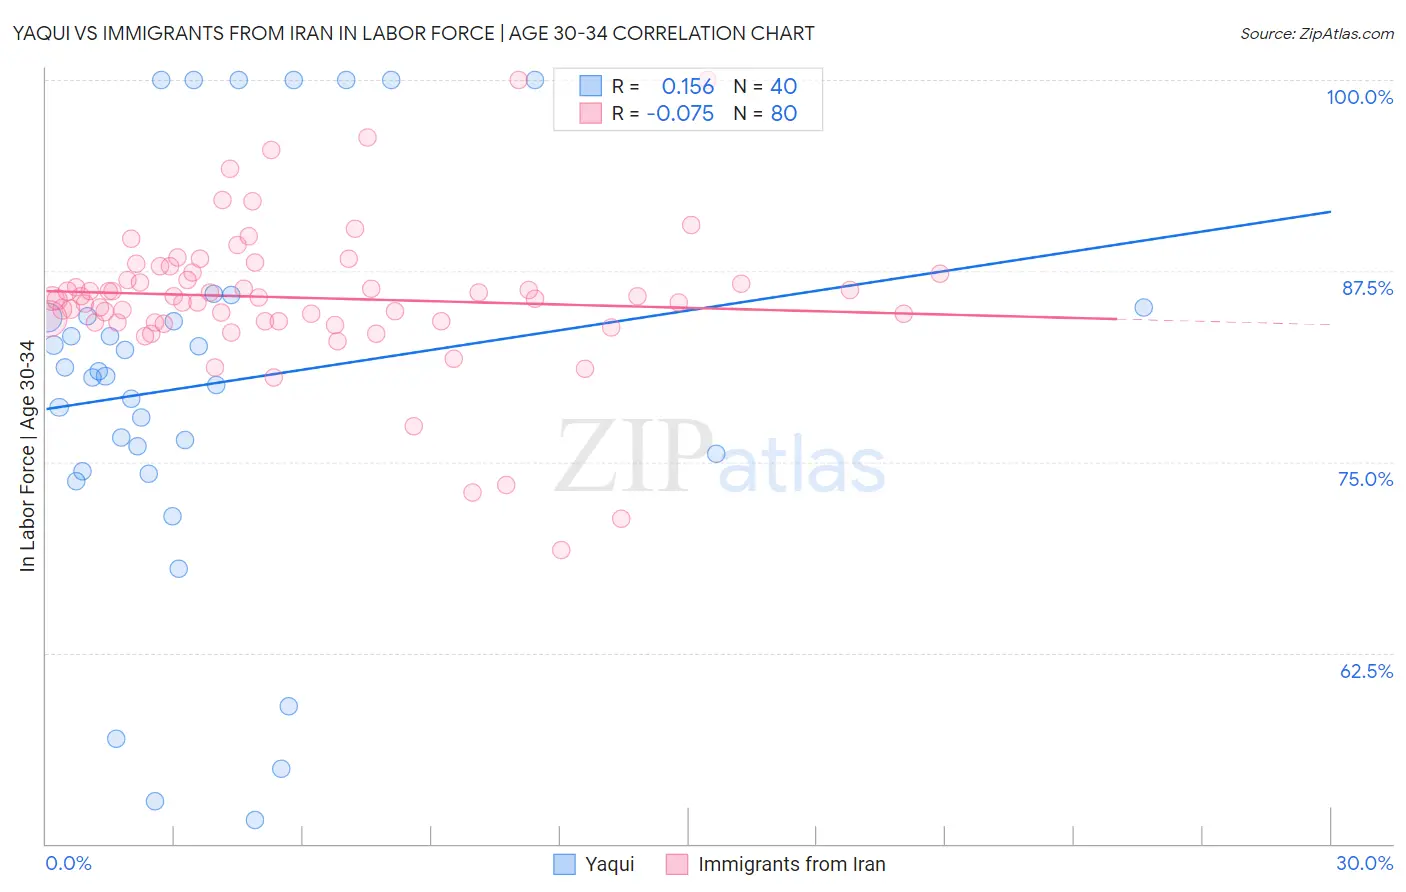
Yaqui vs Immigrants from Iran In Labor Force | Age 30-34 Correlation Chart
The statistical analysis conducted on geographies consisting of 107,706,492 people shows a poor positive correlation between the proportion of Yaqui and labor force participation rate among population between the ages 30 and 34 in the United States with a correlation coefficient (R) of 0.156 and weighted average of 81.4%. Similarly, the statistical analysis conducted on geographies consisting of 279,826,659 people shows a slight negative correlation between the proportion of Immigrants from Iran and labor force participation rate among population between the ages 30 and 34 in the United States with a correlation coefficient (R) of -0.075 and weighted average of 85.4%, a difference of 4.9%.
In Labor Force | Age 30-34 Correlation Summary
| Measurement | Yaqui | Immigrants from Iran |
| Minimum | 51.5% | 69.2% |
| Maximum | 100.0% | 100.0% |
| Range | 48.5% | 30.8% |
| Mean | 80.1% | 85.7% |
| Median | 80.8% | 85.8% |
| Interquartile 25% (IQ1) | 74.9% | 84.2% |
| Interquartile 75% (IQ3) | 84.8% | 87.3% |
| Interquartile Range (IQR) | 9.9% | 3.2% |
| Standard Deviation (Sample) | 13.0% | 4.9% |
| Standard Deviation (Population) | 12.8% | 4.9% |
Similar Demographics by In Labor Force | Age 30-34
Demographics Similar to Yaqui by In Labor Force | Age 30-34
In terms of in labor force | age 30-34, the demographic groups most similar to Yaqui are Choctaw (81.4%, a difference of 0.020%), Shoshone (81.4%, a difference of 0.020%), Alaska Native (81.3%, a difference of 0.080%), Immigrants from the Azores (81.5%, a difference of 0.10%), and Arapaho (81.5%, a difference of 0.10%).
| Demographics | Rating | Rank | In Labor Force | Age 30-34 |
| Iroquois | 0.0 /100 | #313 | Tragic 81.9% |
| Alaskan Athabascans | 0.0 /100 | #314 | Tragic 81.7% |
| Cherokee | 0.0 /100 | #315 | Tragic 81.6% |
| Immigrants | Azores | 0.0 /100 | #316 | Tragic 81.5% |
| Arapaho | 0.0 /100 | #317 | Tragic 81.5% |
| Choctaw | 0.0 /100 | #318 | Tragic 81.4% |
| Shoshone | 0.0 /100 | #319 | Tragic 81.4% |
| Yaqui | 0.0 /100 | #320 | Tragic 81.4% |
| Alaska Natives | 0.0 /100 | #321 | Tragic 81.3% |
| Puerto Ricans | 0.0 /100 | #322 | Tragic 81.2% |
| Paiute | 0.0 /100 | #323 | Tragic 81.2% |
| Cheyenne | 0.0 /100 | #324 | Tragic 81.1% |
| Dutch West Indians | 0.0 /100 | #325 | Tragic 81.0% |
| Seminole | 0.0 /100 | #326 | Tragic 80.8% |
| Colville | 0.0 /100 | #327 | Tragic 80.7% |
Demographics Similar to Immigrants from Iran by In Labor Force | Age 30-34
In terms of in labor force | age 30-34, the demographic groups most similar to Immigrants from Iran are Brazilian (85.4%, a difference of 0.020%), Immigrants from Eastern Europe (85.4%, a difference of 0.030%), Immigrants from Japan (85.4%, a difference of 0.030%), Immigrants from China (85.4%, a difference of 0.030%), and Indian (Asian) (85.4%, a difference of 0.030%).
| Demographics | Rating | Rank | In Labor Force | Age 30-34 |
| Soviet Union | 99.4 /100 | #62 | Exceptional 85.5% |
| Macedonians | 99.4 /100 | #63 | Exceptional 85.5% |
| Italians | 99.4 /100 | #64 | Exceptional 85.4% |
| Senegalese | 99.4 /100 | #65 | Exceptional 85.4% |
| Ghanaians | 99.4 /100 | #66 | Exceptional 85.4% |
| Kenyans | 99.3 /100 | #67 | Exceptional 85.4% |
| Immigrants | Eastern Europe | 99.3 /100 | #68 | Exceptional 85.4% |
| Immigrants | Iran | 99.2 /100 | #69 | Exceptional 85.4% |
| Brazilians | 99.1 /100 | #70 | Exceptional 85.4% |
| Immigrants | Japan | 99.1 /100 | #71 | Exceptional 85.4% |
| Immigrants | China | 99.0 /100 | #72 | Exceptional 85.4% |
| Indians (Asian) | 99.0 /100 | #73 | Exceptional 85.4% |
| Maltese | 99.0 /100 | #74 | Exceptional 85.4% |
| Immigrants | Czechoslovakia | 99.0 /100 | #75 | Exceptional 85.4% |
| Iranians | 99.0 /100 | #76 | Exceptional 85.4% |