Yaqui vs Immigrants from Iran Householder Income Ages 45 - 64 years
COMPARE
Yaqui
Immigrants from Iran
Householder Income Ages 45 - 64 years
Householder Income Ages 45 - 64 years Comparison
Yaqui
Immigrants from Iran
$86,914
HOUSEHOLDER INCOME AGES 45 - 64 YEARS
0.1/ 100
METRIC RATING
281st/ 347
METRIC RANK
$126,940
HOUSEHOLDER INCOME AGES 45 - 64 YEARS
100.0/ 100
METRIC RATING
8th/ 347
METRIC RANK
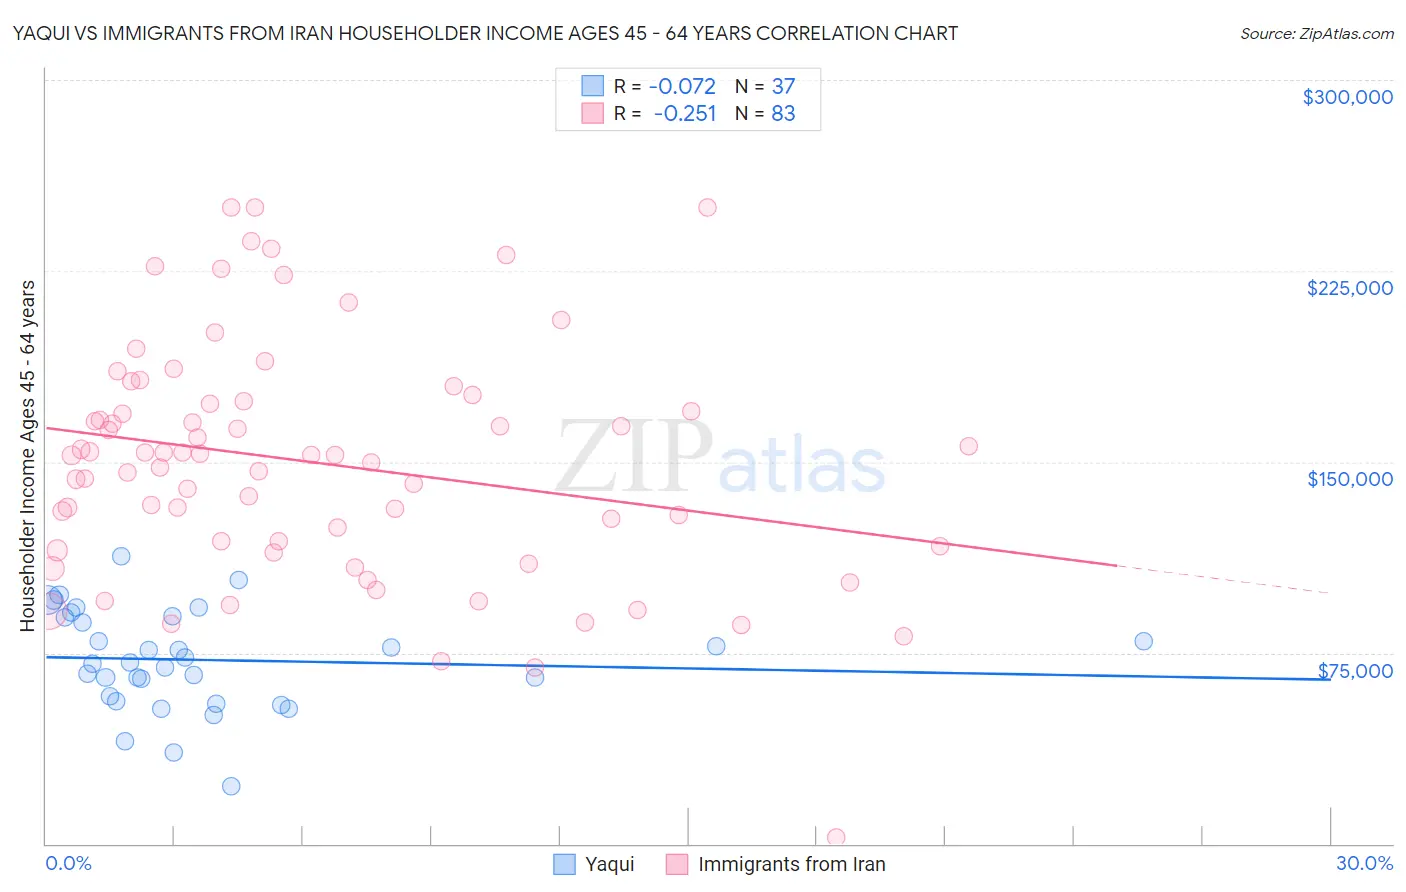
Yaqui vs Immigrants from Iran Householder Income Ages 45 - 64 years Correlation Chart
The statistical analysis conducted on geographies consisting of 107,688,425 people shows a slight negative correlation between the proportion of Yaqui and household income with householder between the ages 45 and 64 in the United States with a correlation coefficient (R) of -0.072 and weighted average of $86,914. Similarly, the statistical analysis conducted on geographies consisting of 279,706,842 people shows a weak negative correlation between the proportion of Immigrants from Iran and household income with householder between the ages 45 and 64 in the United States with a correlation coefficient (R) of -0.251 and weighted average of $126,940, a difference of 46.1%.
Householder Income Ages 45 - 64 years Correlation Summary
| Measurement | Yaqui | Immigrants from Iran |
| Minimum | $22,708 | $2,499 |
| Maximum | $112,855 | $250,001 |
| Range | $90,147 | $247,502 |
| Mean | $72,181 | $149,657 |
| Median | $71,412 | $152,624 |
| Interquartile 25% (IQ1) | $56,921 | $116,625 |
| Interquartile 75% (IQ3) | $88,961 | $173,869 |
| Interquartile Range (IQR) | $32,041 | $57,244 |
| Standard Deviation (Sample) | $19,685 | $46,822 |
| Standard Deviation (Population) | $19,417 | $46,539 |
Similar Demographics by Householder Income Ages 45 - 64 years
Demographics Similar to Yaqui by Householder Income Ages 45 - 64 years
In terms of householder income ages 45 - 64 years, the demographic groups most similar to Yaqui are Senegalese ($86,897, a difference of 0.020%), Immigrants from Somalia ($86,987, a difference of 0.080%), Yakama ($86,992, a difference of 0.090%), Mexican ($86,816, a difference of 0.11%), and Immigrants from Jamaica ($87,035, a difference of 0.14%).
| Demographics | Rating | Rank | Householder Income Ages 45 - 64 years |
| Iroquois | 0.1 /100 | #274 | Tragic $87,255 |
| Immigrants | Belize | 0.1 /100 | #275 | Tragic $87,229 |
| Immigrants | Latin America | 0.1 /100 | #276 | Tragic $87,219 |
| Cree | 0.1 /100 | #277 | Tragic $87,185 |
| Immigrants | Jamaica | 0.1 /100 | #278 | Tragic $87,035 |
| Yakama | 0.1 /100 | #279 | Tragic $86,992 |
| Immigrants | Somalia | 0.1 /100 | #280 | Tragic $86,987 |
| Yaqui | 0.1 /100 | #281 | Tragic $86,914 |
| Senegalese | 0.1 /100 | #282 | Tragic $86,897 |
| Mexicans | 0.1 /100 | #283 | Tragic $86,816 |
| Central American Indians | 0.1 /100 | #284 | Tragic $86,764 |
| Blackfeet | 0.1 /100 | #285 | Tragic $86,595 |
| Immigrants | Guatemala | 0.1 /100 | #286 | Tragic $86,573 |
| Bangladeshis | 0.1 /100 | #287 | Tragic $86,402 |
| Immigrants | St. Vincent and the Grenadines | 0.1 /100 | #288 | Tragic $86,394 |
Demographics Similar to Immigrants from Iran by Householder Income Ages 45 - 64 years
In terms of householder income ages 45 - 64 years, the demographic groups most similar to Immigrants from Iran are Immigrants from Hong Kong ($127,500, a difference of 0.44%), Okinawan ($124,796, a difference of 1.7%), Iranian ($129,350, a difference of 1.9%), Immigrants from Singapore ($129,514, a difference of 2.0%), and Thai ($129,560, a difference of 2.1%).
| Demographics | Rating | Rank | Householder Income Ages 45 - 64 years |
| Immigrants | Taiwan | 100.0 /100 | #1 | Exceptional $135,508 |
| Filipinos | 100.0 /100 | #2 | Exceptional $134,910 |
| Immigrants | India | 100.0 /100 | #3 | Exceptional $132,488 |
| Thais | 100.0 /100 | #4 | Exceptional $129,560 |
| Immigrants | Singapore | 100.0 /100 | #5 | Exceptional $129,514 |
| Iranians | 100.0 /100 | #6 | Exceptional $129,350 |
| Immigrants | Hong Kong | 100.0 /100 | #7 | Exceptional $127,500 |
| Immigrants | Iran | 100.0 /100 | #8 | Exceptional $126,940 |
| Okinawans | 100.0 /100 | #9 | Exceptional $124,796 |
| Immigrants | South Central Asia | 100.0 /100 | #10 | Exceptional $124,188 |
| Cypriots | 100.0 /100 | #11 | Exceptional $123,396 |
| Immigrants | Israel | 100.0 /100 | #12 | Exceptional $122,893 |
| Immigrants | Ireland | 100.0 /100 | #13 | Exceptional $122,757 |
| Indians (Asian) | 100.0 /100 | #14 | Exceptional $122,343 |
| Immigrants | Eastern Asia | 100.0 /100 | #15 | Exceptional $122,222 |