West Indian vs Immigrants from Iran In Labor Force | Age 30-34
COMPARE
West Indian
Immigrants from Iran
In Labor Force | Age 30-34
In Labor Force | Age 30-34 Comparison
West Indians
Immigrants from Iran
84.1%
IN LABOR FORCE | AGE 30-34
1.9/ 100
METRIC RATING
233rd/ 347
METRIC RANK
85.4%
IN LABOR FORCE | AGE 30-34
99.2/ 100
METRIC RATING
69th/ 347
METRIC RANK
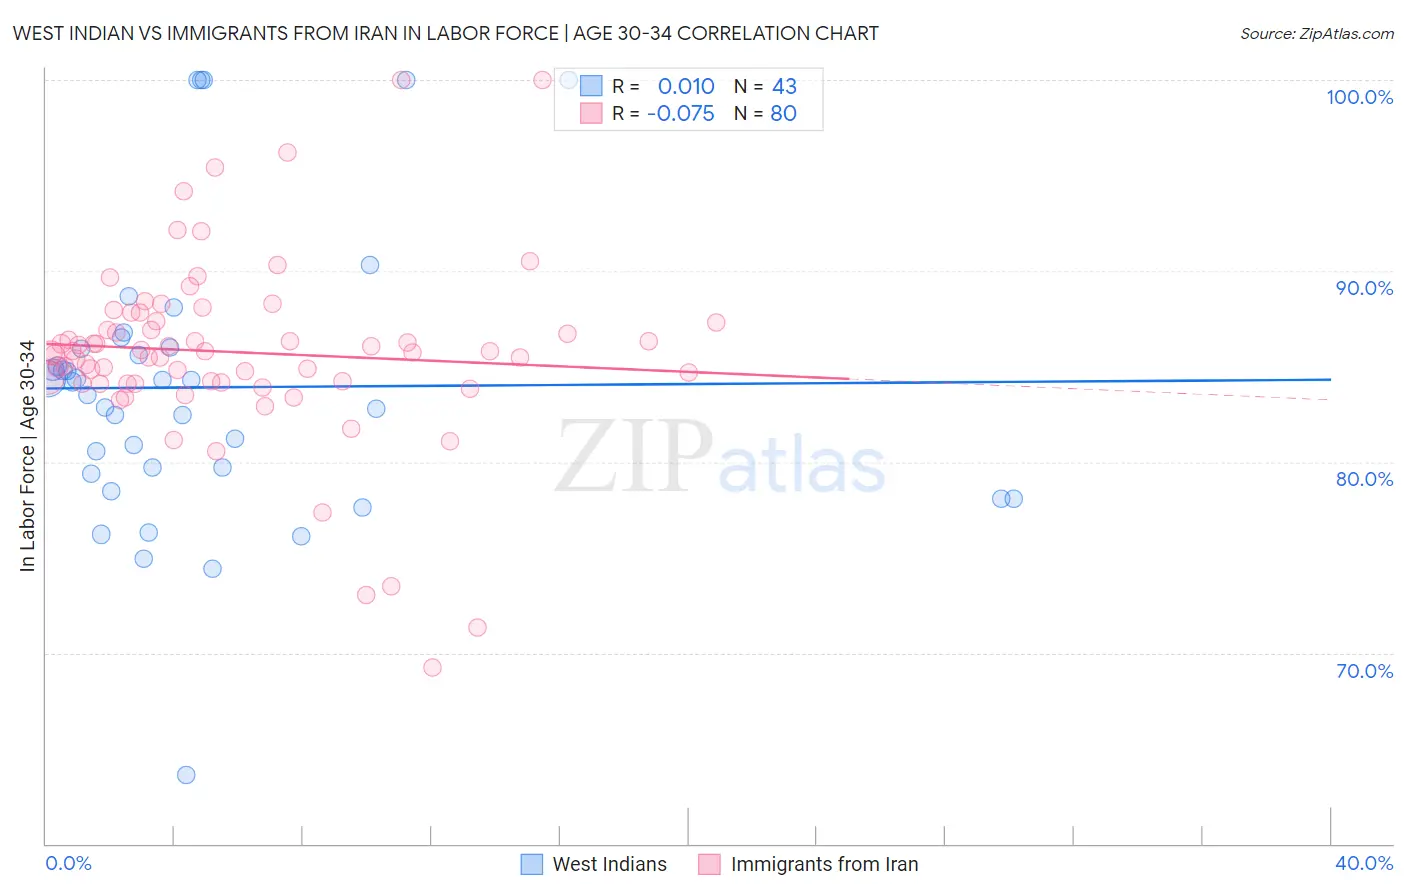
West Indian vs Immigrants from Iran In Labor Force | Age 30-34 Correlation Chart
The statistical analysis conducted on geographies consisting of 253,917,995 people shows no correlation between the proportion of West Indians and labor force participation rate among population between the ages 30 and 34 in the United States with a correlation coefficient (R) of 0.010 and weighted average of 84.1%. Similarly, the statistical analysis conducted on geographies consisting of 279,826,659 people shows a slight negative correlation between the proportion of Immigrants from Iran and labor force participation rate among population between the ages 30 and 34 in the United States with a correlation coefficient (R) of -0.075 and weighted average of 85.4%, a difference of 1.5%.
In Labor Force | Age 30-34 Correlation Summary
| Measurement | West Indian | Immigrants from Iran |
| Minimum | 63.6% | 69.2% |
| Maximum | 100.0% | 100.0% |
| Range | 36.4% | 30.8% |
| Mean | 83.9% | 85.7% |
| Median | 84.2% | 85.8% |
| Interquartile 25% (IQ1) | 79.4% | 84.2% |
| Interquartile 75% (IQ3) | 86.0% | 87.3% |
| Interquartile Range (IQR) | 6.6% | 3.2% |
| Standard Deviation (Sample) | 7.6% | 4.9% |
| Standard Deviation (Population) | 7.5% | 4.9% |
Similar Demographics by In Labor Force | Age 30-34
Demographics Similar to West Indians by In Labor Force | Age 30-34
In terms of in labor force | age 30-34, the demographic groups most similar to West Indians are Immigrants (84.1%, a difference of 0.010%), Haitian (84.1%, a difference of 0.010%), French American Indian (84.1%, a difference of 0.020%), Malaysian (84.1%, a difference of 0.030%), and U.S. Virgin Islander (84.1%, a difference of 0.040%).
| Demographics | Rating | Rank | In Labor Force | Age 30-34 |
| Immigrants | El Salvador | 3.0 /100 | #226 | Tragic 84.2% |
| Immigrants | Cuba | 3.0 /100 | #227 | Tragic 84.2% |
| Immigrants | Haiti | 2.8 /100 | #228 | Tragic 84.2% |
| Welsh | 2.7 /100 | #229 | Tragic 84.2% |
| Immigrants | Bahamas | 2.6 /100 | #230 | Tragic 84.1% |
| Malaysians | 2.2 /100 | #231 | Tragic 84.1% |
| Immigrants | Immigrants | 2.0 /100 | #232 | Tragic 84.1% |
| West Indians | 1.9 /100 | #233 | Tragic 84.1% |
| Haitians | 1.8 /100 | #234 | Tragic 84.1% |
| French American Indians | 1.7 /100 | #235 | Tragic 84.1% |
| U.S. Virgin Islanders | 1.5 /100 | #236 | Tragic 84.1% |
| Celtics | 1.4 /100 | #237 | Tragic 84.1% |
| Immigrants | Barbados | 1.4 /100 | #238 | Tragic 84.0% |
| English | 1.4 /100 | #239 | Tragic 84.0% |
| Venezuelans | 1.3 /100 | #240 | Tragic 84.0% |
Demographics Similar to Immigrants from Iran by In Labor Force | Age 30-34
In terms of in labor force | age 30-34, the demographic groups most similar to Immigrants from Iran are Brazilian (85.4%, a difference of 0.020%), Immigrants from Eastern Europe (85.4%, a difference of 0.030%), Immigrants from Japan (85.4%, a difference of 0.030%), Immigrants from China (85.4%, a difference of 0.030%), and Indian (Asian) (85.4%, a difference of 0.030%).
| Demographics | Rating | Rank | In Labor Force | Age 30-34 |
| Soviet Union | 99.4 /100 | #62 | Exceptional 85.5% |
| Macedonians | 99.4 /100 | #63 | Exceptional 85.5% |
| Italians | 99.4 /100 | #64 | Exceptional 85.4% |
| Senegalese | 99.4 /100 | #65 | Exceptional 85.4% |
| Ghanaians | 99.4 /100 | #66 | Exceptional 85.4% |
| Kenyans | 99.3 /100 | #67 | Exceptional 85.4% |
| Immigrants | Eastern Europe | 99.3 /100 | #68 | Exceptional 85.4% |
| Immigrants | Iran | 99.2 /100 | #69 | Exceptional 85.4% |
| Brazilians | 99.1 /100 | #70 | Exceptional 85.4% |
| Immigrants | Japan | 99.1 /100 | #71 | Exceptional 85.4% |
| Immigrants | China | 99.0 /100 | #72 | Exceptional 85.4% |
| Indians (Asian) | 99.0 /100 | #73 | Exceptional 85.4% |
| Maltese | 99.0 /100 | #74 | Exceptional 85.4% |
| Immigrants | Czechoslovakia | 99.0 /100 | #75 | Exceptional 85.4% |
| Iranians | 99.0 /100 | #76 | Exceptional 85.4% |