Northern European vs Immigrants from Africa In Labor Force | Age 16-19
COMPARE
Northern European
Immigrants from Africa
In Labor Force | Age 16-19
In Labor Force | Age 16-19 Comparison
Northern Europeans
Immigrants from Africa
40.2%
IN LABOR FORCE | AGE 16-19
100.0/ 100
METRIC RATING
63rd/ 347
METRIC RANK
38.0%
IN LABOR FORCE | AGE 16-19
96.1/ 100
METRIC RATING
125th/ 347
METRIC RANK
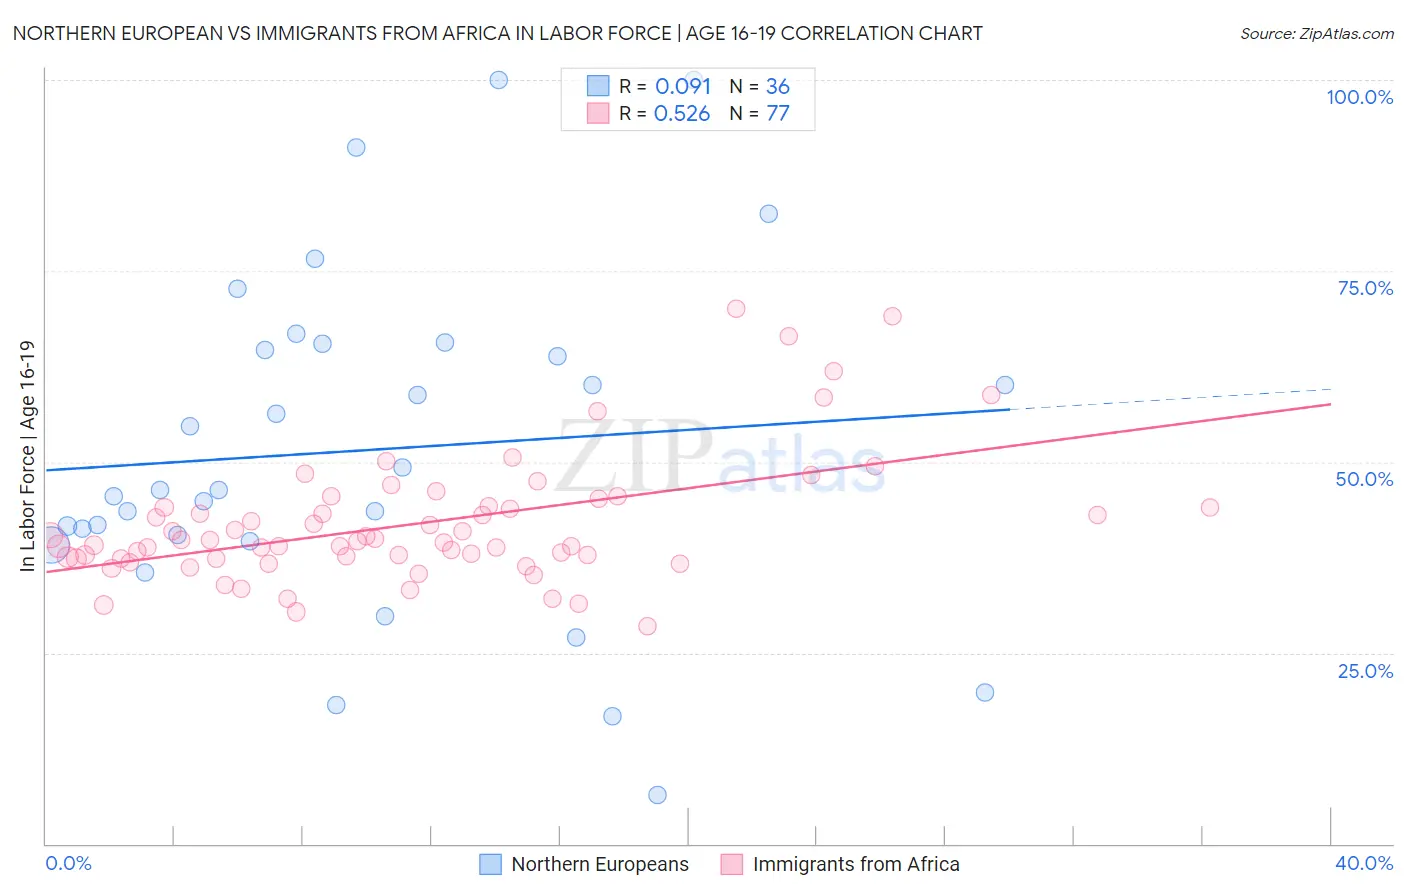
Northern European vs Immigrants from Africa In Labor Force | Age 16-19 Correlation Chart
The statistical analysis conducted on geographies consisting of 405,208,027 people shows a slight positive correlation between the proportion of Northern Europeans and labor force participation rate among population between the ages 16 and 19 in the United States with a correlation coefficient (R) of 0.091 and weighted average of 40.2%. Similarly, the statistical analysis conducted on geographies consisting of 468,482,228 people shows a substantial positive correlation between the proportion of Immigrants from Africa and labor force participation rate among population between the ages 16 and 19 in the United States with a correlation coefficient (R) of 0.526 and weighted average of 38.0%, a difference of 5.7%.
In Labor Force | Age 16-19 Correlation Summary
| Measurement | Northern European | Immigrants from Africa |
| Minimum | 6.4% | 28.5% |
| Maximum | 100.0% | 70.1% |
| Range | 93.6% | 41.6% |
| Mean | 51.6% | 41.9% |
| Median | 46.3% | 39.6% |
| Interquartile 25% (IQ1) | 40.1% | 37.3% |
| Interquartile 75% (IQ3) | 65.1% | 44.1% |
| Interquartile Range (IQR) | 25.0% | 6.7% |
| Standard Deviation (Sample) | 22.1% | 8.3% |
| Standard Deviation (Population) | 21.8% | 8.3% |
Similar Demographics by In Labor Force | Age 16-19
Demographics Similar to Northern Europeans by In Labor Force | Age 16-19
In terms of in labor force | age 16-19, the demographic groups most similar to Northern Europeans are Cherokee (40.2%, a difference of 0.060%), Immigrants from Micronesia (40.2%, a difference of 0.12%), Kenyan (40.1%, a difference of 0.19%), American (40.3%, a difference of 0.20%), and Nonimmigrants (40.1%, a difference of 0.32%).
| Demographics | Rating | Rank | In Labor Force | Age 16-19 |
| Fijians | 100.0 /100 | #56 | Exceptional 40.4% |
| Lithuanians | 100.0 /100 | #57 | Exceptional 40.4% |
| Aleuts | 100.0 /100 | #58 | Exceptional 40.4% |
| Slavs | 100.0 /100 | #59 | Exceptional 40.4% |
| Immigrants | Eastern Africa | 100.0 /100 | #60 | Exceptional 40.4% |
| Americans | 100.0 /100 | #61 | Exceptional 40.3% |
| Cherokee | 100.0 /100 | #62 | Exceptional 40.2% |
| Northern Europeans | 100.0 /100 | #63 | Exceptional 40.2% |
| Immigrants | Micronesia | 100.0 /100 | #64 | Exceptional 40.2% |
| Kenyans | 100.0 /100 | #65 | Exceptional 40.1% |
| Immigrants | Nonimmigrants | 100.0 /100 | #66 | Exceptional 40.1% |
| Canadians | 100.0 /100 | #67 | Exceptional 40.1% |
| Italians | 99.9 /100 | #68 | Exceptional 40.1% |
| Potawatomi | 99.9 /100 | #69 | Exceptional 40.0% |
| Portuguese | 99.9 /100 | #70 | Exceptional 40.0% |
Demographics Similar to Immigrants from Africa by In Labor Force | Age 16-19
In terms of in labor force | age 16-19, the demographic groups most similar to Immigrants from Africa are Immigrants from England (38.1%, a difference of 0.10%), African (38.0%, a difference of 0.16%), Choctaw (38.0%, a difference of 0.16%), New Zealander (38.0%, a difference of 0.17%), and Seminole (38.1%, a difference of 0.19%).
| Demographics | Rating | Rank | In Labor Force | Age 16-19 |
| Immigrants | Nepal | 97.8 /100 | #118 | Exceptional 38.3% |
| Assyrians/Chaldeans/Syriacs | 97.8 /100 | #119 | Exceptional 38.3% |
| Ukrainians | 97.6 /100 | #120 | Exceptional 38.3% |
| Ethiopians | 97.4 /100 | #121 | Exceptional 38.2% |
| Guamanians/Chamorros | 97.4 /100 | #122 | Exceptional 38.2% |
| Seminole | 96.7 /100 | #123 | Exceptional 38.1% |
| Immigrants | England | 96.4 /100 | #124 | Exceptional 38.1% |
| Immigrants | Africa | 96.1 /100 | #125 | Exceptional 38.0% |
| Africans | 95.6 /100 | #126 | Exceptional 38.0% |
| Choctaw | 95.6 /100 | #127 | Exceptional 38.0% |
| New Zealanders | 95.6 /100 | #128 | Exceptional 38.0% |
| Spaniards | 95.5 /100 | #129 | Exceptional 38.0% |
| Immigrants | Zimbabwe | 95.4 /100 | #130 | Exceptional 38.0% |
| Immigrants | Austria | 95.0 /100 | #131 | Exceptional 37.9% |
| Immigrants | Oceania | 94.7 /100 | #132 | Exceptional 37.9% |