Ugandan vs Immigrants from Belarus Householder Income Ages 25 - 44 years
COMPARE
Ugandan
Immigrants from Belarus
Householder Income Ages 25 - 44 years
Householder Income Ages 25 - 44 years Comparison
Ugandans
Immigrants from Belarus
$96,667
HOUSEHOLDER INCOME AGES 25 - 44 YEARS
76.2/ 100
METRIC RATING
150th/ 347
METRIC RANK
$107,393
HOUSEHOLDER INCOME AGES 25 - 44 YEARS
99.9/ 100
METRIC RATING
46th/ 347
METRIC RANK
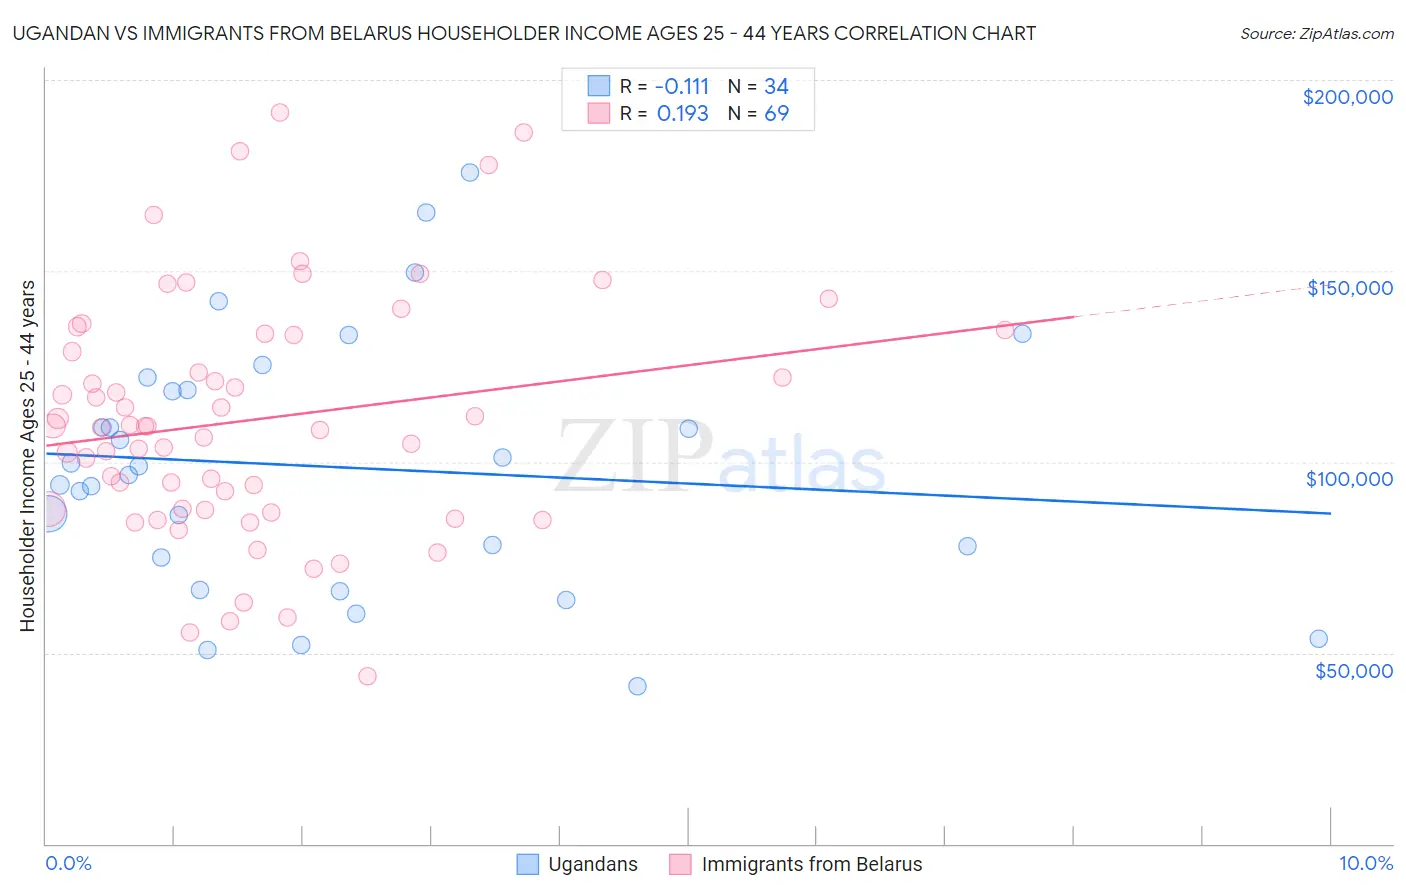
Ugandan vs Immigrants from Belarus Householder Income Ages 25 - 44 years Correlation Chart
The statistical analysis conducted on geographies consisting of 93,976,499 people shows a poor negative correlation between the proportion of Ugandans and household income with householder between the ages 25 and 44 in the United States with a correlation coefficient (R) of -0.111 and weighted average of $96,667. Similarly, the statistical analysis conducted on geographies consisting of 150,157,706 people shows a poor positive correlation between the proportion of Immigrants from Belarus and household income with householder between the ages 25 and 44 in the United States with a correlation coefficient (R) of 0.193 and weighted average of $107,393, a difference of 11.1%.
Householder Income Ages 25 - 44 years Correlation Summary
| Measurement | Ugandan | Immigrants from Belarus |
| Minimum | $41,159 | $43,724 |
| Maximum | $175,893 | $191,528 |
| Range | $134,734 | $147,804 |
| Mean | $98,580 | $111,122 |
| Median | $97,758 | $109,354 |
| Interquartile 25% (IQ1) | $74,874 | $87,522 |
| Interquartile 75% (IQ3) | $118,938 | $133,299 |
| Interquartile Range (IQR) | $44,063 | $45,777 |
| Standard Deviation (Sample) | $33,089 | $31,608 |
| Standard Deviation (Population) | $32,599 | $31,378 |
Similar Demographics by Householder Income Ages 25 - 44 years
Demographics Similar to Ugandans by Householder Income Ages 25 - 44 years
In terms of householder income ages 25 - 44 years, the demographic groups most similar to Ugandans are Basque ($96,709, a difference of 0.040%), Irish ($96,730, a difference of 0.070%), Immigrants from Syria ($96,789, a difference of 0.13%), Czech ($96,525, a difference of 0.15%), and Ethiopian ($96,824, a difference of 0.16%).
| Demographics | Rating | Rank | Householder Income Ages 25 - 44 years |
| Immigrants | Jordan | 81.0 /100 | #143 | Excellent $97,185 |
| Immigrants | Chile | 80.8 /100 | #144 | Excellent $97,159 |
| Norwegians | 78.2 /100 | #145 | Good $96,866 |
| Ethiopians | 77.8 /100 | #146 | Good $96,824 |
| Immigrants | Syria | 77.4 /100 | #147 | Good $96,789 |
| Irish | 76.9 /100 | #148 | Good $96,730 |
| Basques | 76.6 /100 | #149 | Good $96,709 |
| Ugandans | 76.2 /100 | #150 | Good $96,667 |
| Czechs | 74.8 /100 | #151 | Good $96,525 |
| South American Indians | 74.5 /100 | #152 | Good $96,497 |
| Slovenes | 73.9 /100 | #153 | Good $96,439 |
| Slavs | 73.2 /100 | #154 | Good $96,377 |
| Moroccans | 70.3 /100 | #155 | Good $96,117 |
| Immigrants | Germany | 67.9 /100 | #156 | Good $95,913 |
| Immigrants | Uganda | 65.2 /100 | #157 | Good $95,698 |
Demographics Similar to Immigrants from Belarus by Householder Income Ages 25 - 44 years
In terms of householder income ages 25 - 44 years, the demographic groups most similar to Immigrants from Belarus are Estonian ($107,269, a difference of 0.12%), Bulgarian ($107,264, a difference of 0.12%), Immigrants from Turkey ($107,258, a difference of 0.13%), Israeli ($107,579, a difference of 0.17%), and Immigrants from Indonesia ($107,627, a difference of 0.22%).
| Demographics | Rating | Rank | Householder Income Ages 25 - 44 years |
| Immigrants | France | 99.9 /100 | #39 | Exceptional $108,257 |
| Immigrants | Lithuania | 99.9 /100 | #40 | Exceptional $108,149 |
| Immigrants | Bolivia | 99.9 /100 | #41 | Exceptional $108,128 |
| Australians | 99.9 /100 | #42 | Exceptional $107,912 |
| Immigrants | Malaysia | 99.9 /100 | #43 | Exceptional $107,650 |
| Immigrants | Indonesia | 99.9 /100 | #44 | Exceptional $107,627 |
| Israelis | 99.9 /100 | #45 | Exceptional $107,579 |
| Immigrants | Belarus | 99.9 /100 | #46 | Exceptional $107,393 |
| Estonians | 99.9 /100 | #47 | Exceptional $107,269 |
| Bulgarians | 99.9 /100 | #48 | Exceptional $107,264 |
| Immigrants | Turkey | 99.9 /100 | #49 | Exceptional $107,258 |
| Cambodians | 99.9 /100 | #50 | Exceptional $107,148 |
| Immigrants | Czechoslovakia | 99.9 /100 | #51 | Exceptional $106,888 |
| Immigrants | Europe | 99.9 /100 | #52 | Exceptional $106,817 |
| Immigrants | Norway | 99.9 /100 | #53 | Exceptional $106,629 |