Immigrants from Grenada vs Cheyenne In Labor Force | Age 20-24
COMPARE
Immigrants from Grenada
Cheyenne
In Labor Force | Age 20-24
In Labor Force | Age 20-24 Comparison
Immigrants from Grenada
Cheyenne
67.2%
IN LABOR FORCE | AGE 20-24
0.0/ 100
METRIC RATING
344th/ 347
METRIC RANK
73.4%
IN LABOR FORCE | AGE 20-24
0.2/ 100
METRIC RATING
273rd/ 347
METRIC RANK
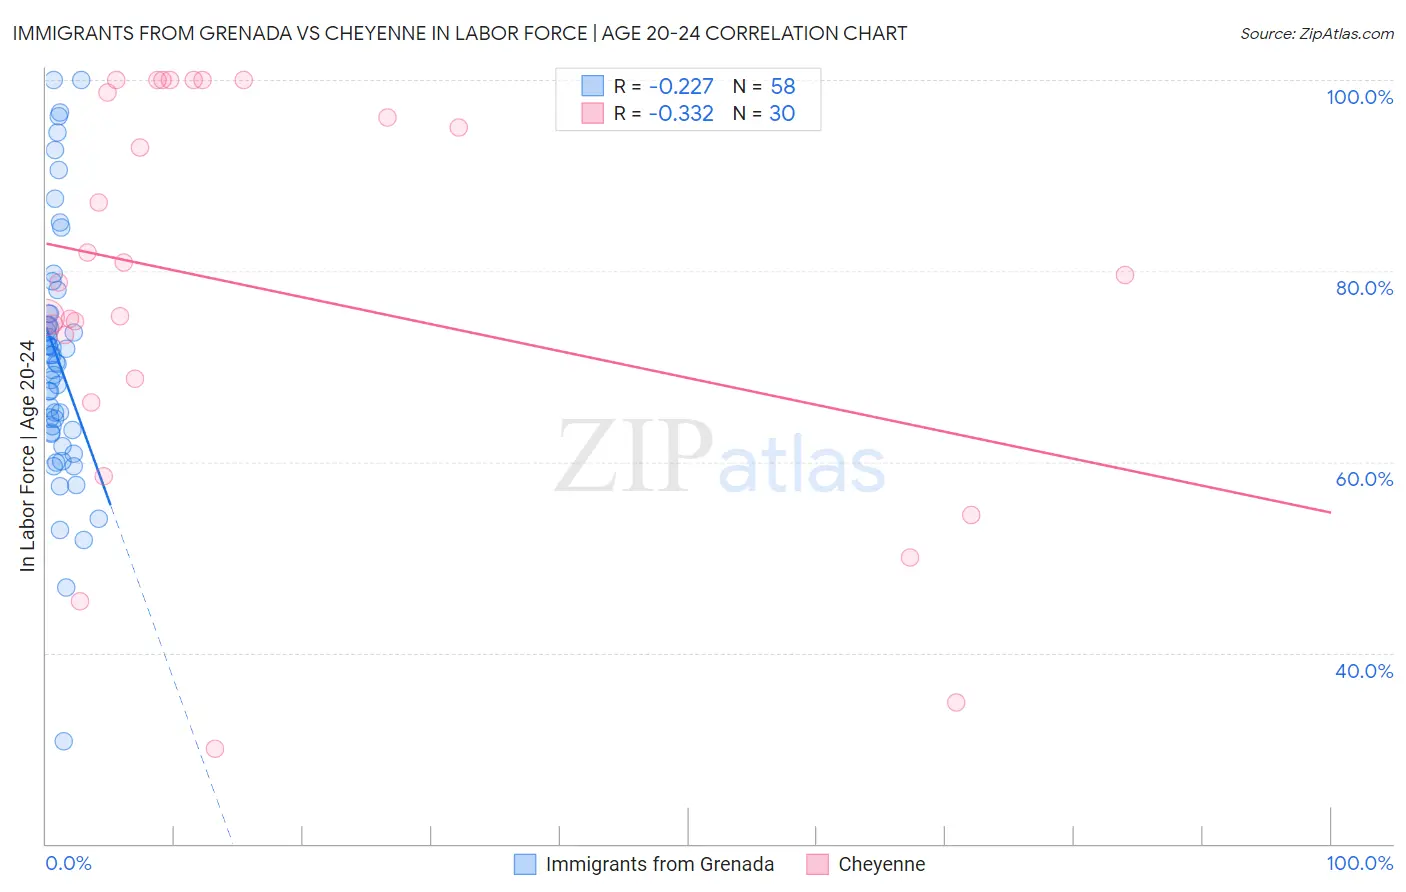
Immigrants from Grenada vs Cheyenne In Labor Force | Age 20-24 Correlation Chart
The statistical analysis conducted on geographies consisting of 67,199,646 people shows a weak negative correlation between the proportion of Immigrants from Grenada and labor force participation rate among population between the ages 20 and 24 in the United States with a correlation coefficient (R) of -0.227 and weighted average of 67.2%. Similarly, the statistical analysis conducted on geographies consisting of 80,658,593 people shows a mild negative correlation between the proportion of Cheyenne and labor force participation rate among population between the ages 20 and 24 in the United States with a correlation coefficient (R) of -0.332 and weighted average of 73.4%, a difference of 9.3%.
In Labor Force | Age 20-24 Correlation Summary
| Measurement | Immigrants from Grenada | Cheyenne |
| Minimum | 30.8% | 30.0% |
| Maximum | 100.0% | 100.0% |
| Range | 69.2% | 70.0% |
| Mean | 70.7% | 78.2% |
| Median | 70.3% | 79.2% |
| Interquartile 25% (IQ1) | 63.1% | 68.6% |
| Interquartile 75% (IQ3) | 75.5% | 98.7% |
| Interquartile Range (IQR) | 12.4% | 30.1% |
| Standard Deviation (Sample) | 13.3% | 20.4% |
| Standard Deviation (Population) | 13.1% | 20.0% |
Similar Demographics by In Labor Force | Age 20-24
Demographics Similar to Immigrants from Grenada by In Labor Force | Age 20-24
In terms of in labor force | age 20-24, the demographic groups most similar to Immigrants from Grenada are Puerto Rican (68.3%, a difference of 1.7%), Hopi (66.0%, a difference of 1.7%), Immigrants from St. Vincent and the Grenadines (68.4%, a difference of 1.8%), Tohono O'odham (68.6%, a difference of 2.1%), and Menominee (68.7%, a difference of 2.3%).
| Demographics | Rating | Rank | In Labor Force | Age 20-24 |
| Yuman | 0.0 /100 | #333 | Tragic 70.3% |
| British West Indians | 0.0 /100 | #334 | Tragic 70.0% |
| Immigrants | Barbados | 0.0 /100 | #335 | Tragic 69.7% |
| Immigrants | Guyana | 0.0 /100 | #336 | Tragic 69.3% |
| Guyanese | 0.0 /100 | #337 | Tragic 69.2% |
| Pima | 0.0 /100 | #338 | Tragic 69.0% |
| Immigrants | Yemen | 0.0 /100 | #339 | Tragic 68.9% |
| Menominee | 0.0 /100 | #340 | Tragic 68.7% |
| Tohono O'odham | 0.0 /100 | #341 | Tragic 68.6% |
| Immigrants | St. Vincent and the Grenadines | 0.0 /100 | #342 | Tragic 68.4% |
| Puerto Ricans | 0.0 /100 | #343 | Tragic 68.3% |
| Immigrants | Grenada | 0.0 /100 | #344 | Tragic 67.2% |
| Hopi | 0.0 /100 | #345 | Tragic 66.0% |
| Lumbee | 0.0 /100 | #346 | Tragic 65.5% |
| Navajo | 0.0 /100 | #347 | Tragic 64.8% |
Demographics Similar to Cheyenne by In Labor Force | Age 20-24
In terms of in labor force | age 20-24, the demographic groups most similar to Cheyenne are Immigrants from Colombia (73.4%, a difference of 0.020%), Belizean (73.4%, a difference of 0.030%), Immigrants from Indonesia (73.4%, a difference of 0.040%), Immigrants from South America (73.3%, a difference of 0.070%), and Mongolian (73.3%, a difference of 0.080%).
| Demographics | Rating | Rank | In Labor Force | Age 20-24 |
| Haitians | 0.5 /100 | #266 | Tragic 73.6% |
| Immigrants | Western Asia | 0.4 /100 | #267 | Tragic 73.5% |
| South Americans | 0.4 /100 | #268 | Tragic 73.5% |
| Colombians | 0.3 /100 | #269 | Tragic 73.5% |
| Immigrants | Russia | 0.3 /100 | #270 | Tragic 73.5% |
| Immigrants | Indonesia | 0.3 /100 | #271 | Tragic 73.4% |
| Belizeans | 0.3 /100 | #272 | Tragic 73.4% |
| Cheyenne | 0.2 /100 | #273 | Tragic 73.4% |
| Immigrants | Colombia | 0.2 /100 | #274 | Tragic 73.4% |
| Immigrants | South America | 0.2 /100 | #275 | Tragic 73.3% |
| Mongolians | 0.2 /100 | #276 | Tragic 73.3% |
| Immigrants | Malaysia | 0.2 /100 | #277 | Tragic 73.3% |
| Cypriots | 0.2 /100 | #278 | Tragic 73.3% |
| Venezuelans | 0.2 /100 | #279 | Tragic 73.3% |
| Bahamians | 0.1 /100 | #280 | Tragic 73.3% |