Tsimshian vs Canadian In Labor Force | Age 16-19
COMPARE
Tsimshian
Canadian
In Labor Force | Age 16-19
In Labor Force | Age 16-19 Comparison
Tsimshian
Canadians
37.4%
IN LABOR FORCE | AGE 16-19
84.7/ 100
METRIC RATING
150th/ 347
METRIC RANK
40.1%
IN LABOR FORCE | AGE 16-19
100.0/ 100
METRIC RATING
67th/ 347
METRIC RANK
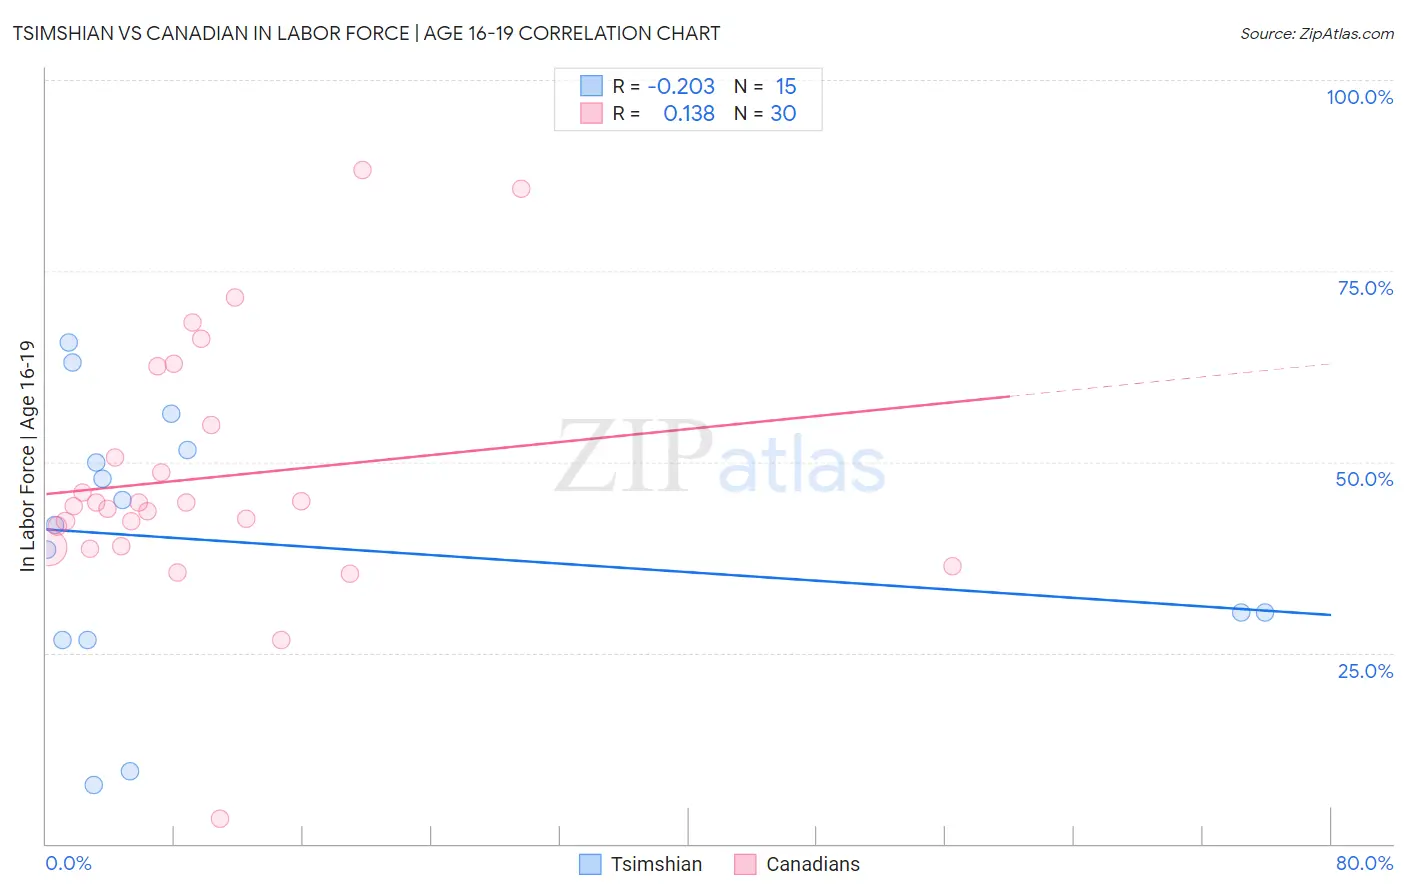
Tsimshian vs Canadian In Labor Force | Age 16-19 Correlation Chart
The statistical analysis conducted on geographies consisting of 15,624,472 people shows a weak negative correlation between the proportion of Tsimshian and labor force participation rate among population between the ages 16 and 19 in the United States with a correlation coefficient (R) of -0.203 and weighted average of 37.4%. Similarly, the statistical analysis conducted on geographies consisting of 436,563,556 people shows a poor positive correlation between the proportion of Canadians and labor force participation rate among population between the ages 16 and 19 in the United States with a correlation coefficient (R) of 0.138 and weighted average of 40.1%, a difference of 7.3%.
In Labor Force | Age 16-19 Correlation Summary
| Measurement | Tsimshian | Canadian |
| Minimum | 7.7% | 3.2% |
| Maximum | 65.7% | 88.2% |
| Range | 58.0% | 85.0% |
| Mean | 39.4% | 47.9% |
| Median | 41.8% | 44.4% |
| Interquartile 25% (IQ1) | 26.6% | 39.0% |
| Interquartile 75% (IQ3) | 51.5% | 54.8% |
| Interquartile Range (IQR) | 24.9% | 15.8% |
| Standard Deviation (Sample) | 17.5% | 16.8% |
| Standard Deviation (Population) | 16.9% | 16.6% |
Similar Demographics by In Labor Force | Age 16-19
Demographics Similar to Tsimshian by In Labor Force | Age 16-19
In terms of in labor force | age 16-19, the demographic groups most similar to Tsimshian are Native Hawaiian (37.4%, a difference of 0.030%), Immigrants from Poland (37.3%, a difference of 0.030%), Immigrants from Sierra Leone (37.3%, a difference of 0.10%), Arapaho (37.3%, a difference of 0.25%), and Romanian (37.5%, a difference of 0.26%).
| Demographics | Rating | Rank | In Labor Force | Age 16-19 |
| Pakistanis | 89.5 /100 | #143 | Excellent 37.6% |
| Japanese | 89.3 /100 | #144 | Excellent 37.5% |
| Paiute | 89.3 /100 | #145 | Excellent 37.5% |
| Immigrants | Western Europe | 88.9 /100 | #146 | Excellent 37.5% |
| Brazilians | 88.7 /100 | #147 | Excellent 37.5% |
| Romanians | 87.3 /100 | #148 | Excellent 37.5% |
| Native Hawaiians | 85.0 /100 | #149 | Excellent 37.4% |
| Tsimshian | 84.7 /100 | #150 | Excellent 37.4% |
| Immigrants | Poland | 84.4 /100 | #151 | Excellent 37.3% |
| Immigrants | Sierra Leone | 83.6 /100 | #152 | Excellent 37.3% |
| Arapaho | 81.8 /100 | #153 | Excellent 37.3% |
| Immigrants | Bulgaria | 81.6 /100 | #154 | Excellent 37.3% |
| Immigrants | Lithuania | 80.7 /100 | #155 | Excellent 37.2% |
| Kiowa | 80.4 /100 | #156 | Excellent 37.2% |
| Immigrants | Brazil | 76.5 /100 | #157 | Good 37.1% |
Demographics Similar to Canadians by In Labor Force | Age 16-19
In terms of in labor force | age 16-19, the demographic groups most similar to Canadians are Nonimmigrants (40.1%, a difference of 0.010%), Italian (40.1%, a difference of 0.060%), Kenyan (40.1%, a difference of 0.13%), Potawatomi (40.0%, a difference of 0.13%), and Portuguese (40.0%, a difference of 0.18%).
| Demographics | Rating | Rank | In Labor Force | Age 16-19 |
| Immigrants | Eastern Africa | 100.0 /100 | #60 | Exceptional 40.4% |
| Americans | 100.0 /100 | #61 | Exceptional 40.3% |
| Cherokee | 100.0 /100 | #62 | Exceptional 40.2% |
| Northern Europeans | 100.0 /100 | #63 | Exceptional 40.2% |
| Immigrants | Micronesia | 100.0 /100 | #64 | Exceptional 40.2% |
| Kenyans | 100.0 /100 | #65 | Exceptional 40.1% |
| Immigrants | Nonimmigrants | 100.0 /100 | #66 | Exceptional 40.1% |
| Canadians | 100.0 /100 | #67 | Exceptional 40.1% |
| Italians | 99.9 /100 | #68 | Exceptional 40.1% |
| Potawatomi | 99.9 /100 | #69 | Exceptional 40.0% |
| Portuguese | 99.9 /100 | #70 | Exceptional 40.0% |
| Serbians | 99.9 /100 | #71 | Exceptional 39.9% |
| Iroquois | 99.9 /100 | #72 | Exceptional 39.9% |
| Immigrants | Middle Africa | 99.9 /100 | #73 | Exceptional 39.9% |
| Hungarians | 99.9 /100 | #74 | Exceptional 39.8% |