Tsimshian vs Immigrants from Eastern Europe In Labor Force | Age 16-19
COMPARE
Tsimshian
Immigrants from Eastern Europe
In Labor Force | Age 16-19
In Labor Force | Age 16-19 Comparison
Tsimshian
Immigrants from Eastern Europe
37.4%
IN LABOR FORCE | AGE 16-19
84.7/ 100
METRIC RATING
150th/ 347
METRIC RANK
35.8%
IN LABOR FORCE | AGE 16-19
14.5/ 100
METRIC RATING
207th/ 347
METRIC RANK
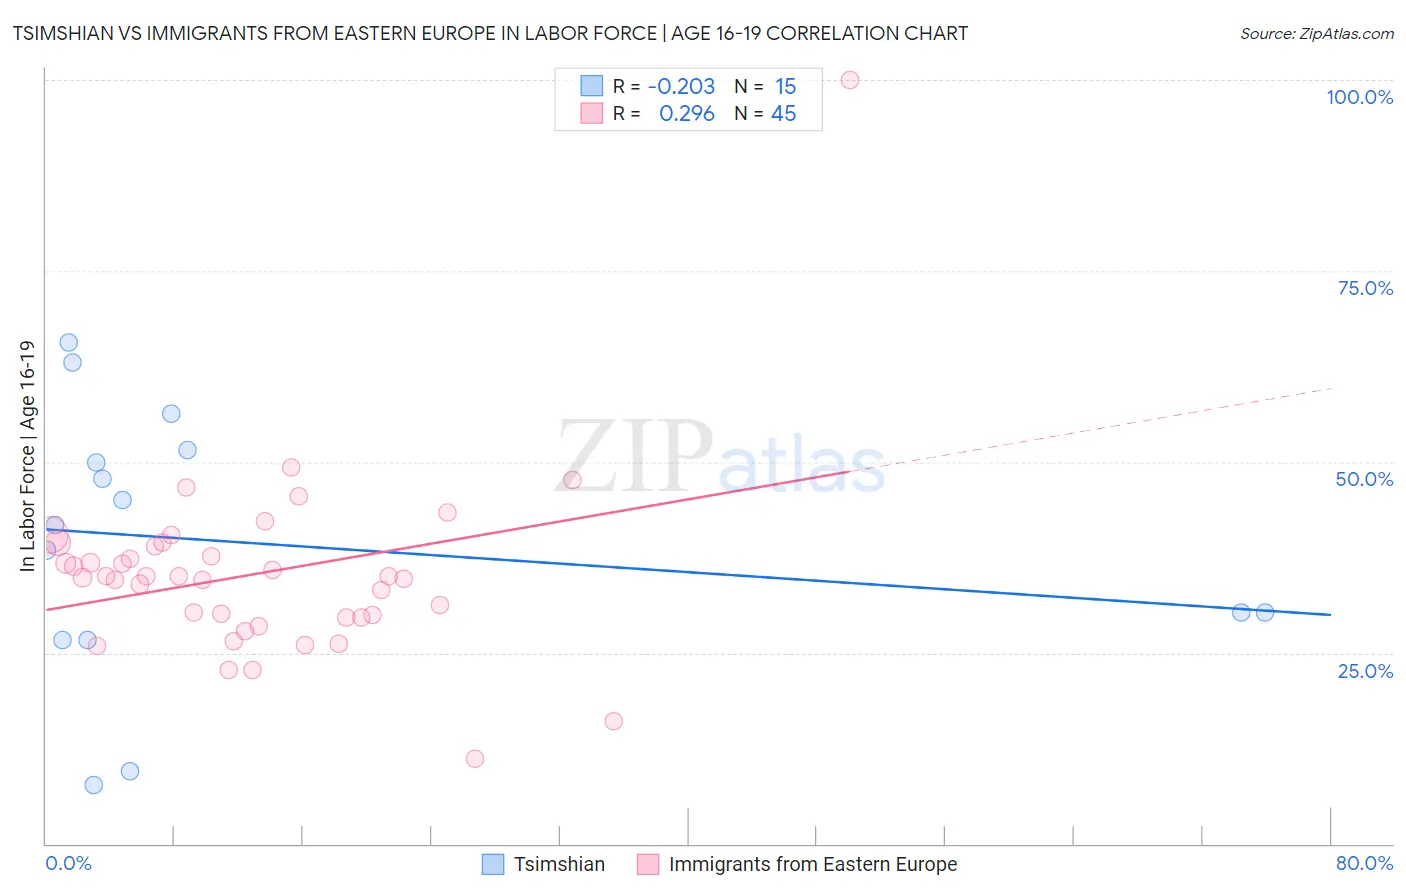
Tsimshian vs Immigrants from Eastern Europe In Labor Force | Age 16-19 Correlation Chart
The statistical analysis conducted on geographies consisting of 15,624,472 people shows a weak negative correlation between the proportion of Tsimshian and labor force participation rate among population between the ages 16 and 19 in the United States with a correlation coefficient (R) of -0.203 and weighted average of 37.4%. Similarly, the statistical analysis conducted on geographies consisting of 474,546,835 people shows a weak positive correlation between the proportion of Immigrants from Eastern Europe and labor force participation rate among population between the ages 16 and 19 in the United States with a correlation coefficient (R) of 0.296 and weighted average of 35.8%, a difference of 4.5%.
In Labor Force | Age 16-19 Correlation Summary
| Measurement | Tsimshian | Immigrants from Eastern Europe |
| Minimum | 7.7% | 11.2% |
| Maximum | 65.7% | 100.0% |
| Range | 58.0% | 88.8% |
| Mean | 39.4% | 35.4% |
| Median | 41.8% | 35.0% |
| Interquartile 25% (IQ1) | 26.6% | 29.6% |
| Interquartile 75% (IQ3) | 51.5% | 39.2% |
| Interquartile Range (IQR) | 24.9% | 9.6% |
| Standard Deviation (Sample) | 17.5% | 12.5% |
| Standard Deviation (Population) | 16.9% | 12.4% |
Similar Demographics by In Labor Force | Age 16-19
Demographics Similar to Tsimshian by In Labor Force | Age 16-19
In terms of in labor force | age 16-19, the demographic groups most similar to Tsimshian are Native Hawaiian (37.4%, a difference of 0.030%), Immigrants from Poland (37.3%, a difference of 0.030%), Immigrants from Sierra Leone (37.3%, a difference of 0.10%), Arapaho (37.3%, a difference of 0.25%), and Romanian (37.5%, a difference of 0.26%).
| Demographics | Rating | Rank | In Labor Force | Age 16-19 |
| Pakistanis | 89.5 /100 | #143 | Excellent 37.6% |
| Japanese | 89.3 /100 | #144 | Excellent 37.5% |
| Paiute | 89.3 /100 | #145 | Excellent 37.5% |
| Immigrants | Western Europe | 88.9 /100 | #146 | Excellent 37.5% |
| Brazilians | 88.7 /100 | #147 | Excellent 37.5% |
| Romanians | 87.3 /100 | #148 | Excellent 37.5% |
| Native Hawaiians | 85.0 /100 | #149 | Excellent 37.4% |
| Tsimshian | 84.7 /100 | #150 | Excellent 37.4% |
| Immigrants | Poland | 84.4 /100 | #151 | Excellent 37.3% |
| Immigrants | Sierra Leone | 83.6 /100 | #152 | Excellent 37.3% |
| Arapaho | 81.8 /100 | #153 | Excellent 37.3% |
| Immigrants | Bulgaria | 81.6 /100 | #154 | Excellent 37.3% |
| Immigrants | Lithuania | 80.7 /100 | #155 | Excellent 37.2% |
| Kiowa | 80.4 /100 | #156 | Excellent 37.2% |
| Immigrants | Brazil | 76.5 /100 | #157 | Good 37.1% |
Demographics Similar to Immigrants from Eastern Europe by In Labor Force | Age 16-19
In terms of in labor force | age 16-19, the demographic groups most similar to Immigrants from Eastern Europe are South American Indian (35.8%, a difference of 0.020%), Chilean (35.8%, a difference of 0.020%), Immigrants from Albania (35.8%, a difference of 0.050%), Korean (35.7%, a difference of 0.12%), and Moroccan (35.7%, a difference of 0.19%).
| Demographics | Rating | Rank | In Labor Force | Age 16-19 |
| Immigrants | Sweden | 18.8 /100 | #200 | Poor 35.9% |
| Alsatians | 17.5 /100 | #201 | Poor 35.9% |
| Senegalese | 17.4 /100 | #202 | Poor 35.9% |
| Immigrants | Nigeria | 16.8 /100 | #203 | Poor 35.8% |
| Immigrants | Albania | 15.0 /100 | #204 | Poor 35.8% |
| South American Indians | 14.6 /100 | #205 | Poor 35.8% |
| Chileans | 14.6 /100 | #206 | Poor 35.8% |
| Immigrants | Eastern Europe | 14.5 /100 | #207 | Poor 35.8% |
| Koreans | 13.3 /100 | #208 | Poor 35.7% |
| Moroccans | 12.7 /100 | #209 | Poor 35.7% |
| Immigrants | Switzerland | 11.9 /100 | #210 | Poor 35.6% |
| Mexicans | 11.9 /100 | #211 | Poor 35.6% |
| Houma | 11.0 /100 | #212 | Poor 35.6% |
| Immigrants | Bolivia | 11.0 /100 | #213 | Poor 35.6% |
| Apache | 11.0 /100 | #214 | Poor 35.6% |