Indian (Asian) vs Indonesian In Labor Force | Age 30-34
COMPARE
Indian (Asian)
Indonesian
In Labor Force | Age 30-34
In Labor Force | Age 30-34 Comparison
Indians (Asian)
Indonesians
85.4%
IN LABOR FORCE | AGE 30-34
99.0/ 100
METRIC RATING
73rd/ 347
METRIC RANK
84.3%
IN LABOR FORCE | AGE 30-34
8.8/ 100
METRIC RATING
210th/ 347
METRIC RANK
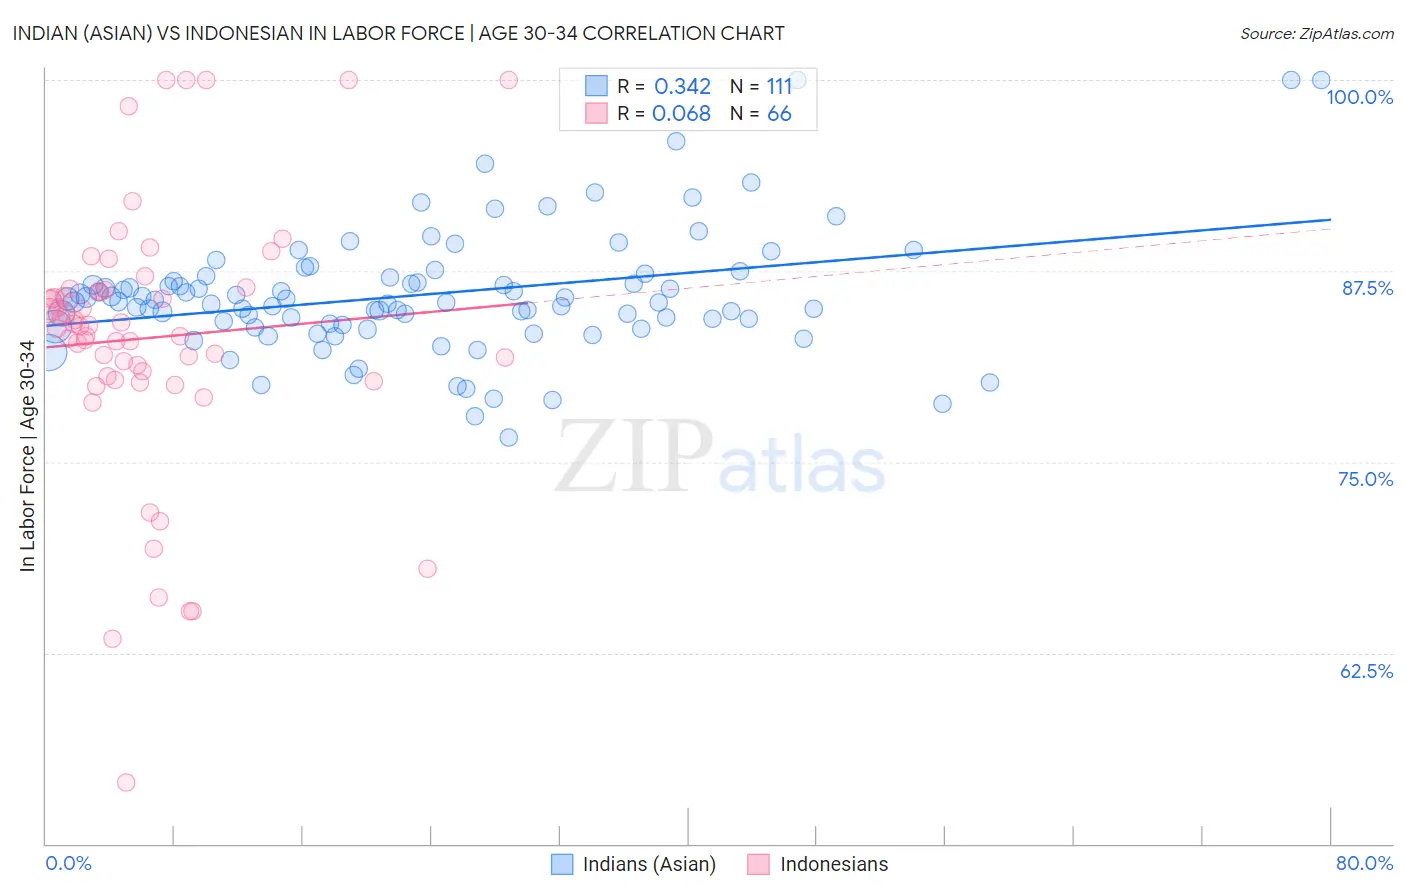
Indian (Asian) vs Indonesian In Labor Force | Age 30-34 Correlation Chart
The statistical analysis conducted on geographies consisting of 494,801,972 people shows a mild positive correlation between the proportion of Indians (Asian) and labor force participation rate among population between the ages 30 and 34 in the United States with a correlation coefficient (R) of 0.342 and weighted average of 85.4%. Similarly, the statistical analysis conducted on geographies consisting of 162,689,196 people shows a slight positive correlation between the proportion of Indonesians and labor force participation rate among population between the ages 30 and 34 in the United States with a correlation coefficient (R) of 0.068 and weighted average of 84.3%, a difference of 1.2%.
In Labor Force | Age 30-34 Correlation Summary
| Measurement | Indian (Asian) | Indonesian |
| Minimum | 76.6% | 54.0% |
| Maximum | 100.0% | 100.0% |
| Range | 23.4% | 46.0% |
| Mean | 85.9% | 83.1% |
| Median | 85.5% | 83.9% |
| Interquartile 25% (IQ1) | 84.0% | 80.6% |
| Interquartile 75% (IQ3) | 87.1% | 86.2% |
| Interquartile Range (IQR) | 3.1% | 5.6% |
| Standard Deviation (Sample) | 4.1% | 8.8% |
| Standard Deviation (Population) | 4.1% | 8.7% |
Similar Demographics by In Labor Force | Age 30-34
Demographics Similar to Indians (Asian) by In Labor Force | Age 30-34
In terms of in labor force | age 30-34, the demographic groups most similar to Indians (Asian) are Immigrants from China (85.4%, a difference of 0.0%), Maltese (85.4%, a difference of 0.0%), Brazilian (85.4%, a difference of 0.010%), Immigrants from Japan (85.4%, a difference of 0.010%), and Immigrants from Czechoslovakia (85.4%, a difference of 0.010%).
| Demographics | Rating | Rank | In Labor Force | Age 30-34 |
| Ghanaians | 99.4 /100 | #66 | Exceptional 85.4% |
| Kenyans | 99.3 /100 | #67 | Exceptional 85.4% |
| Immigrants | Eastern Europe | 99.3 /100 | #68 | Exceptional 85.4% |
| Immigrants | Iran | 99.2 /100 | #69 | Exceptional 85.4% |
| Brazilians | 99.1 /100 | #70 | Exceptional 85.4% |
| Immigrants | Japan | 99.1 /100 | #71 | Exceptional 85.4% |
| Immigrants | China | 99.0 /100 | #72 | Exceptional 85.4% |
| Indians (Asian) | 99.0 /100 | #73 | Exceptional 85.4% |
| Maltese | 99.0 /100 | #74 | Exceptional 85.4% |
| Immigrants | Czechoslovakia | 99.0 /100 | #75 | Exceptional 85.4% |
| Iranians | 99.0 /100 | #76 | Exceptional 85.4% |
| Immigrants | Eastern Asia | 98.9 /100 | #77 | Exceptional 85.4% |
| Immigrants | Singapore | 98.8 /100 | #78 | Exceptional 85.3% |
| Immigrants | Switzerland | 98.7 /100 | #79 | Exceptional 85.3% |
| Immigrants | Russia | 98.7 /100 | #80 | Exceptional 85.3% |
Demographics Similar to Indonesians by In Labor Force | Age 30-34
In terms of in labor force | age 30-34, the demographic groups most similar to Indonesians are Arab (84.3%, a difference of 0.0%), Jamaican (84.3%, a difference of 0.0%), Japanese (84.3%, a difference of 0.0%), Bangladeshi (84.3%, a difference of 0.010%), and Immigrants from Western Asia (84.3%, a difference of 0.010%).
| Demographics | Rating | Rank | In Labor Force | Age 30-34 |
| Canadians | 15.4 /100 | #203 | Poor 84.4% |
| Ecuadorians | 14.2 /100 | #204 | Poor 84.4% |
| French | 13.8 /100 | #205 | Poor 84.4% |
| Lebanese | 10.6 /100 | #206 | Poor 84.4% |
| Bangladeshis | 9.4 /100 | #207 | Tragic 84.3% |
| Arabs | 8.9 /100 | #208 | Tragic 84.3% |
| Jamaicans | 8.8 /100 | #209 | Tragic 84.3% |
| Indonesians | 8.8 /100 | #210 | Tragic 84.3% |
| Japanese | 8.8 /100 | #211 | Tragic 84.3% |
| Immigrants | Western Asia | 8.2 /100 | #212 | Tragic 84.3% |
| Immigrants | Jamaica | 7.9 /100 | #213 | Tragic 84.3% |
| Immigrants | Germany | 7.2 /100 | #214 | Tragic 84.3% |
| Europeans | 7.2 /100 | #215 | Tragic 84.3% |
| Immigrants | Ecuador | 7.1 /100 | #216 | Tragic 84.3% |
| Immigrants | Trinidad and Tobago | 7.0 /100 | #217 | Tragic 84.3% |