Lebanese vs Immigrants from Cameroon In Labor Force | Age 20-24
COMPARE
Lebanese
Immigrants from Cameroon
In Labor Force | Age 20-24
In Labor Force | Age 20-24 Comparison
Lebanese
Immigrants from Cameroon
75.3%
IN LABOR FORCE | AGE 20-24
73.5/ 100
METRIC RATING
152nd/ 347
METRIC RANK
76.6%
IN LABOR FORCE | AGE 20-24
99.6/ 100
METRIC RATING
77th/ 347
METRIC RANK
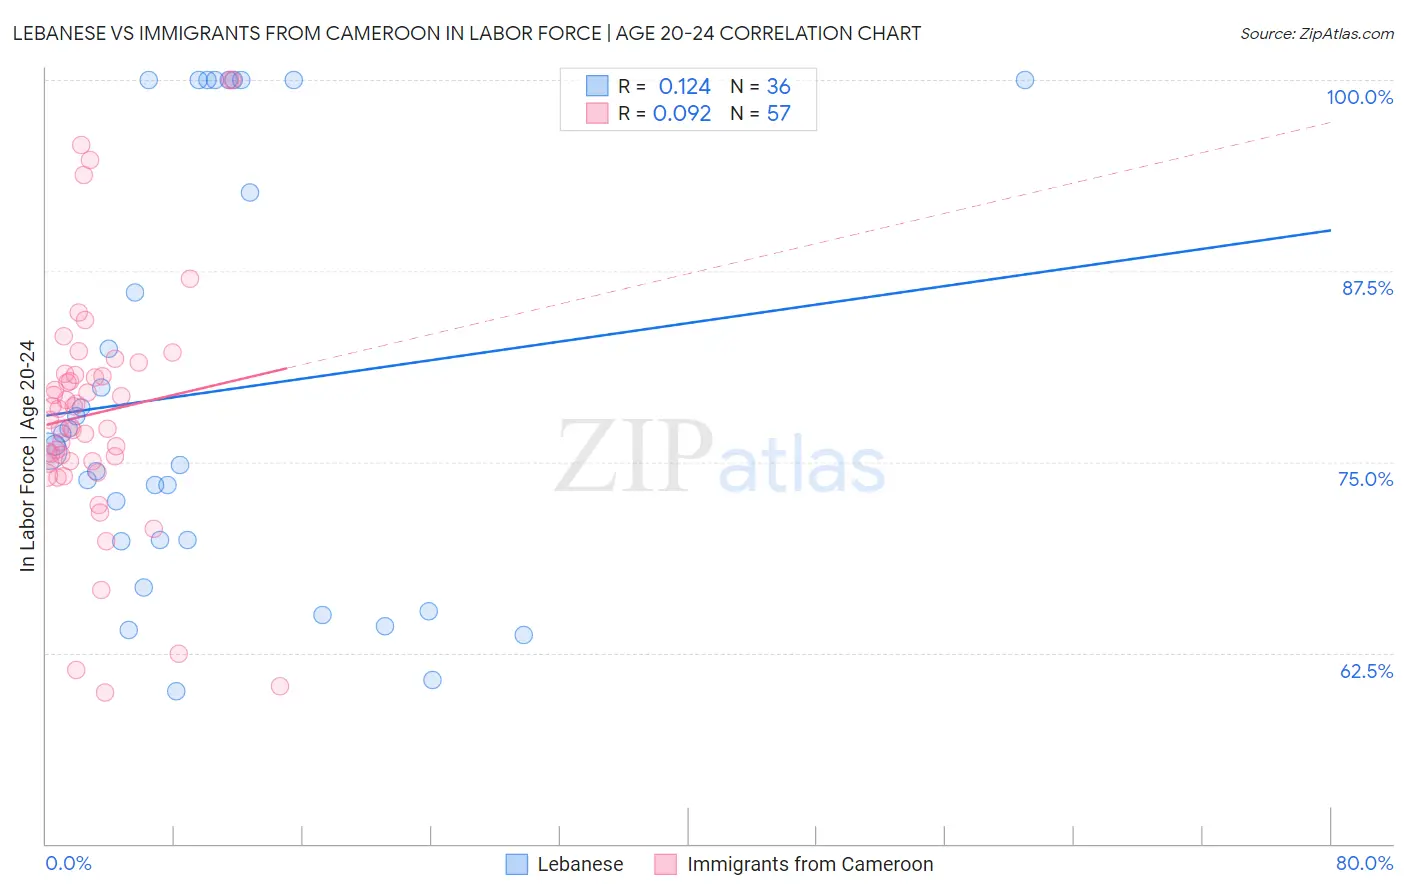
Lebanese vs Immigrants from Cameroon In Labor Force | Age 20-24 Correlation Chart
The statistical analysis conducted on geographies consisting of 401,460,432 people shows a poor positive correlation between the proportion of Lebanese and labor force participation rate among population between the ages 20 and 24 in the United States with a correlation coefficient (R) of 0.124 and weighted average of 75.3%. Similarly, the statistical analysis conducted on geographies consisting of 130,759,306 people shows a slight positive correlation between the proportion of Immigrants from Cameroon and labor force participation rate among population between the ages 20 and 24 in the United States with a correlation coefficient (R) of 0.092 and weighted average of 76.6%, a difference of 1.7%.
In Labor Force | Age 20-24 Correlation Summary
| Measurement | Lebanese | Immigrants from Cameroon |
| Minimum | 60.0% | 59.9% |
| Maximum | 100.0% | 100.0% |
| Range | 40.0% | 40.1% |
| Mean | 79.6% | 78.2% |
| Median | 75.9% | 77.8% |
| Interquartile 25% (IQ1) | 69.8% | 75.0% |
| Interquartile 75% (IQ3) | 96.3% | 80.7% |
| Interquartile Range (IQR) | 26.5% | 5.8% |
| Standard Deviation (Sample) | 13.7% | 8.2% |
| Standard Deviation (Population) | 13.5% | 8.1% |
Similar Demographics by In Labor Force | Age 20-24
Demographics Similar to Lebanese by In Labor Force | Age 20-24
In terms of in labor force | age 20-24, the demographic groups most similar to Lebanese are Paiute (75.3%, a difference of 0.010%), Guatemalan (75.3%, a difference of 0.020%), Osage (75.3%, a difference of 0.020%), Salvadoran (75.3%, a difference of 0.030%), and Immigrants from Guatemala (75.3%, a difference of 0.030%).
| Demographics | Rating | Rank | In Labor Force | Age 20-24 |
| Koreans | 79.7 /100 | #145 | Good 75.4% |
| Mexican American Indians | 78.8 /100 | #146 | Good 75.4% |
| Comanche | 77.6 /100 | #147 | Good 75.4% |
| Immigrants | Cambodia | 76.7 /100 | #148 | Good 75.4% |
| Ugandans | 76.1 /100 | #149 | Good 75.4% |
| Salvadorans | 74.8 /100 | #150 | Good 75.3% |
| Paiute | 74.1 /100 | #151 | Good 75.3% |
| Lebanese | 73.5 /100 | #152 | Good 75.3% |
| Guatemalans | 72.3 /100 | #153 | Good 75.3% |
| Osage | 72.3 /100 | #154 | Good 75.3% |
| Immigrants | Guatemala | 71.9 /100 | #155 | Good 75.3% |
| Immigrants | El Salvador | 71.7 /100 | #156 | Good 75.3% |
| Immigrants | Western Europe | 71.5 /100 | #157 | Good 75.3% |
| Immigrants | Bolivia | 71.0 /100 | #158 | Good 75.3% |
| South American Indians | 69.0 /100 | #159 | Good 75.3% |
Demographics Similar to Immigrants from Cameroon by In Labor Force | Age 20-24
In terms of in labor force | age 20-24, the demographic groups most similar to Immigrants from Cameroon are Canadian (76.6%, a difference of 0.0%), Immigrants from Zaire (76.6%, a difference of 0.020%), Immigrants from Moldova (76.6%, a difference of 0.030%), Italian (76.5%, a difference of 0.050%), and Immigrants from Middle Africa (76.6%, a difference of 0.070%).
| Demographics | Rating | Rank | In Labor Force | Age 20-24 |
| Ottawa | 99.8 /100 | #70 | Exceptional 76.8% |
| Northern Europeans | 99.8 /100 | #71 | Exceptional 76.8% |
| Guamanians/Chamorros | 99.8 /100 | #72 | Exceptional 76.7% |
| British | 99.8 /100 | #73 | Exceptional 76.7% |
| Cree | 99.7 /100 | #74 | Exceptional 76.6% |
| Immigrants | Middle Africa | 99.7 /100 | #75 | Exceptional 76.6% |
| Immigrants | Moldova | 99.6 /100 | #76 | Exceptional 76.6% |
| Immigrants | Cameroon | 99.6 /100 | #77 | Exceptional 76.6% |
| Canadians | 99.6 /100 | #78 | Exceptional 76.6% |
| Immigrants | Zaire | 99.6 /100 | #79 | Exceptional 76.6% |
| Italians | 99.6 /100 | #80 | Exceptional 76.5% |
| Basques | 99.5 /100 | #81 | Exceptional 76.5% |
| Hmong | 99.5 /100 | #82 | Exceptional 76.5% |
| Carpatho Rusyns | 99.4 /100 | #83 | Exceptional 76.5% |
| Austrians | 99.4 /100 | #84 | Exceptional 76.5% |