Taiwanese vs Immigrants from Poland In Labor Force | Age 25-29
COMPARE
Taiwanese
Immigrants from Poland
In Labor Force | Age 25-29
In Labor Force | Age 25-29 Comparison
Taiwanese
Immigrants from Poland
85.4%
IN LABOR FORCE | AGE 25-29
99.4/ 100
METRIC RATING
62nd/ 347
METRIC RANK
85.6%
IN LABOR FORCE | AGE 25-29
99.7/ 100
METRIC RATING
52nd/ 347
METRIC RANK
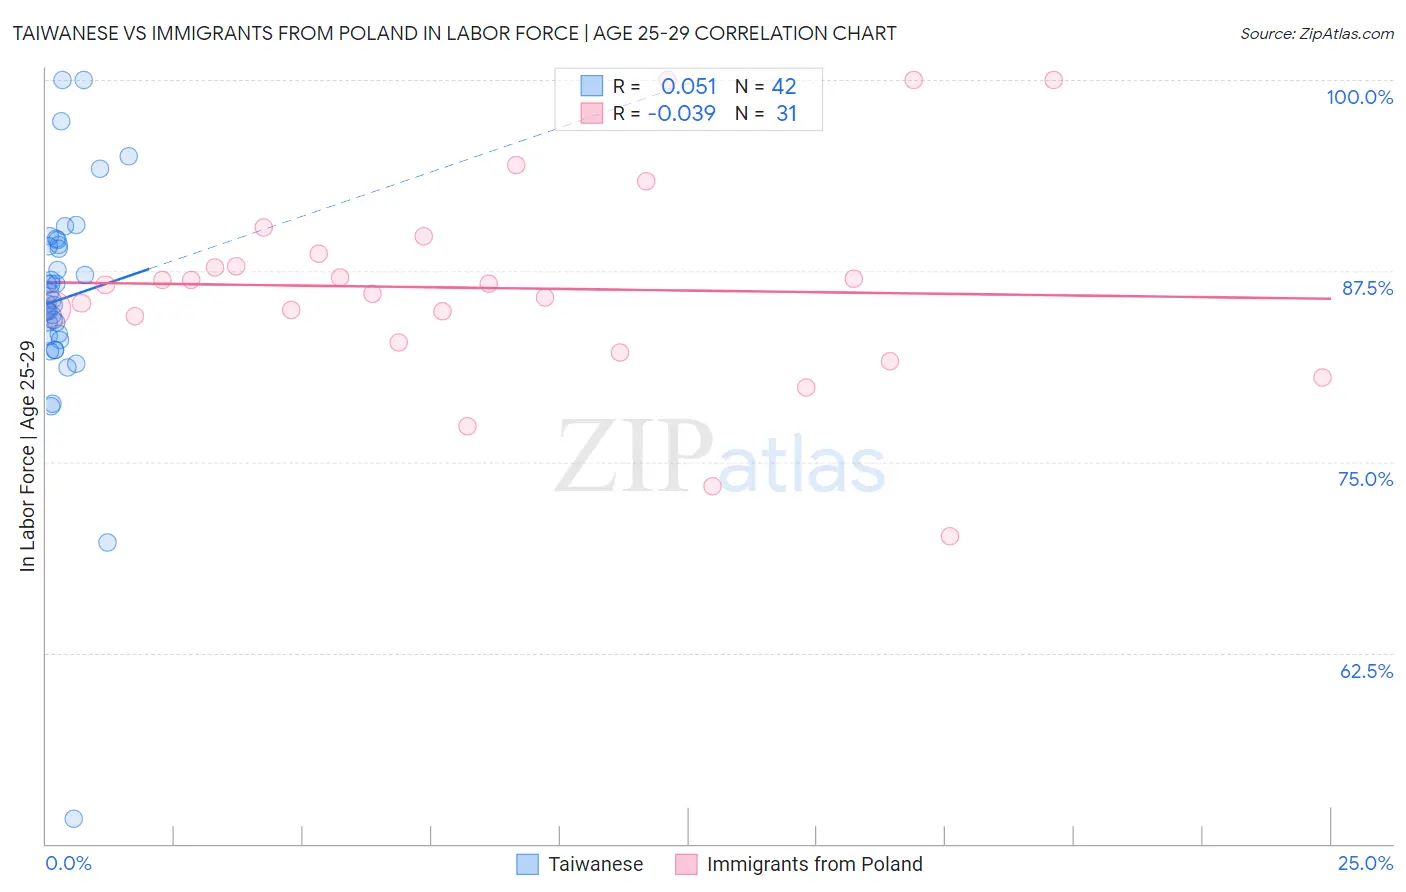
Taiwanese vs Immigrants from Poland In Labor Force | Age 25-29 Correlation Chart
The statistical analysis conducted on geographies consisting of 31,716,840 people shows a slight positive correlation between the proportion of Taiwanese and labor force participation rate among population between the ages 25 and 29 in the United States with a correlation coefficient (R) of 0.051 and weighted average of 85.4%. Similarly, the statistical analysis conducted on geographies consisting of 304,774,487 people shows no correlation between the proportion of Immigrants from Poland and labor force participation rate among population between the ages 25 and 29 in the United States with a correlation coefficient (R) of -0.039 and weighted average of 85.6%, a difference of 0.14%.
In Labor Force | Age 25-29 Correlation Summary
| Measurement | Taiwanese | Immigrants from Poland |
| Minimum | 51.6% | 70.1% |
| Maximum | 100.0% | 100.0% |
| Range | 48.4% | 29.9% |
| Mean | 85.7% | 86.4% |
| Median | 85.5% | 86.6% |
| Interquartile 25% (IQ1) | 83.2% | 82.8% |
| Interquartile 75% (IQ3) | 89.2% | 88.6% |
| Interquartile Range (IQR) | 6.0% | 5.8% |
| Standard Deviation (Sample) | 7.7% | 6.7% |
| Standard Deviation (Population) | 7.6% | 6.6% |
Demographics Similar to Taiwanese and Immigrants from Poland by In Labor Force | Age 25-29
In terms of in labor force | age 25-29, the demographic groups most similar to Taiwanese are Immigrants from Kenya (85.4%, a difference of 0.010%), Thai (85.5%, a difference of 0.020%), Serbian (85.5%, a difference of 0.020%), Immigrants from Italy (85.4%, a difference of 0.030%), and Immigrants from Czechoslovakia (85.4%, a difference of 0.030%). Similarly, the demographic groups most similar to Immigrants from Poland are Immigrants from Latvia (85.6%, a difference of 0.020%), Yugoslavian (85.6%, a difference of 0.030%), Belgian (85.5%, a difference of 0.030%), Albanian (85.5%, a difference of 0.030%), and Immigrants from Brazil (85.5%, a difference of 0.040%).
| Demographics | Rating | Rank | In Labor Force | Age 25-29 |
| Turks | 99.8 /100 | #47 | Exceptional 85.6% |
| Italians | 99.8 /100 | #48 | Exceptional 85.6% |
| Swedes | 99.8 /100 | #49 | Exceptional 85.6% |
| Yugoslavians | 99.8 /100 | #50 | Exceptional 85.6% |
| Immigrants | Latvia | 99.8 /100 | #51 | Exceptional 85.6% |
| Immigrants | Poland | 99.7 /100 | #52 | Exceptional 85.6% |
| Belgians | 99.7 /100 | #53 | Exceptional 85.5% |
| Albanians | 99.7 /100 | #54 | Exceptional 85.5% |
| Immigrants | Brazil | 99.7 /100 | #55 | Exceptional 85.5% |
| Eastern Europeans | 99.6 /100 | #56 | Exceptional 85.5% |
| Estonians | 99.6 /100 | #57 | Exceptional 85.5% |
| Greeks | 99.6 /100 | #58 | Exceptional 85.5% |
| Immigrants | Morocco | 99.5 /100 | #59 | Exceptional 85.5% |
| Thais | 99.5 /100 | #60 | Exceptional 85.5% |
| Serbians | 99.5 /100 | #61 | Exceptional 85.5% |
| Taiwanese | 99.4 /100 | #62 | Exceptional 85.4% |
| Immigrants | Kenya | 99.4 /100 | #63 | Exceptional 85.4% |
| Immigrants | Italy | 99.3 /100 | #64 | Exceptional 85.4% |
| Immigrants | Czechoslovakia | 99.3 /100 | #65 | Exceptional 85.4% |
| Immigrants | Scotland | 99.3 /100 | #66 | Exceptional 85.4% |
| Immigrants | Turkey | 99.2 /100 | #67 | Exceptional 85.4% |