Taiwanese vs Immigrants from Spain In Labor Force | Age 30-34
COMPARE
Taiwanese
Immigrants from Spain
In Labor Force | Age 30-34
In Labor Force | Age 30-34 Comparison
Taiwanese
Immigrants from Spain
84.6%
IN LABOR FORCE | AGE 30-34
29.4/ 100
METRIC RATING
188th/ 347
METRIC RANK
85.0%
IN LABOR FORCE | AGE 30-34
90.0/ 100
METRIC RATING
130th/ 347
METRIC RANK
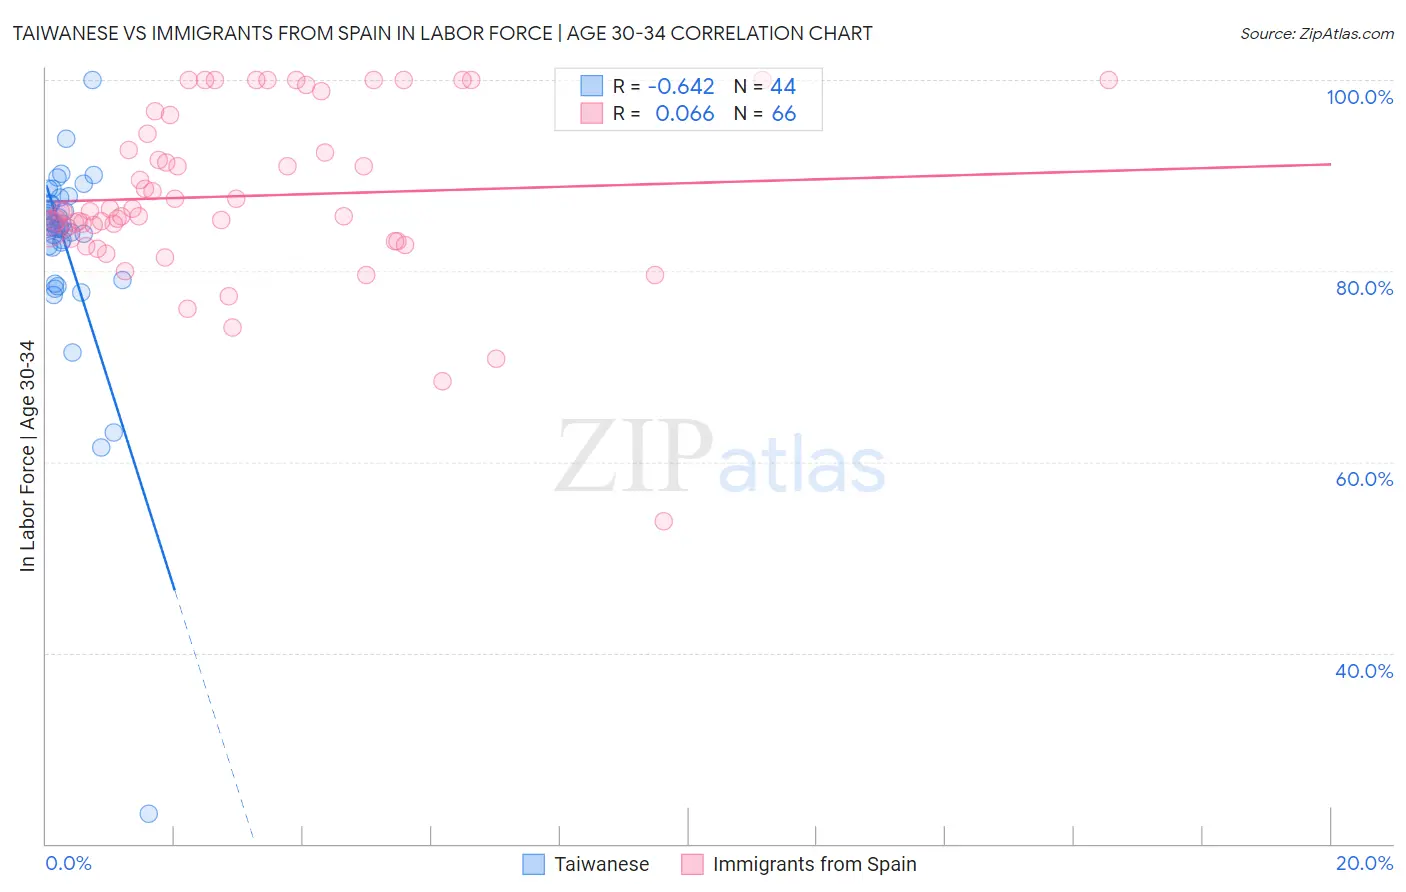
Taiwanese vs Immigrants from Spain In Labor Force | Age 30-34 Correlation Chart
The statistical analysis conducted on geographies consisting of 31,720,118 people shows a significant negative correlation between the proportion of Taiwanese and labor force participation rate among population between the ages 30 and 34 in the United States with a correlation coefficient (R) of -0.642 and weighted average of 84.6%. Similarly, the statistical analysis conducted on geographies consisting of 239,607,955 people shows a slight positive correlation between the proportion of Immigrants from Spain and labor force participation rate among population between the ages 30 and 34 in the United States with a correlation coefficient (R) of 0.066 and weighted average of 85.0%, a difference of 0.54%.
In Labor Force | Age 30-34 Correlation Summary
| Measurement | Taiwanese | Immigrants from Spain |
| Minimum | 23.1% | 53.8% |
| Maximum | 100.0% | 100.0% |
| Range | 76.9% | 46.2% |
| Mean | 82.5% | 87.8% |
| Median | 84.6% | 86.3% |
| Interquartile 25% (IQ1) | 82.5% | 83.4% |
| Interquartile 75% (IQ3) | 87.0% | 94.3% |
| Interquartile Range (IQR) | 4.5% | 10.9% |
| Standard Deviation (Sample) | 11.3% | 8.9% |
| Standard Deviation (Population) | 11.2% | 8.8% |
Similar Demographics by In Labor Force | Age 30-34
Demographics Similar to Taiwanese by In Labor Force | Age 30-34
In terms of in labor force | age 30-34, the demographic groups most similar to Taiwanese are Immigrants from Congo (84.6%, a difference of 0.0%), Costa Rican (84.6%, a difference of 0.0%), Nigerian (84.5%, a difference of 0.0%), Immigrants from Philippines (84.6%, a difference of 0.020%), and Immigrants from North America (84.6%, a difference of 0.030%).
| Demographics | Rating | Rank | In Labor Force | Age 30-34 |
| Moroccans | 40.3 /100 | #181 | Average 84.6% |
| Barbadians | 36.7 /100 | #182 | Fair 84.6% |
| Immigrants | Canada | 35.0 /100 | #183 | Fair 84.6% |
| Immigrants | North America | 33.3 /100 | #184 | Fair 84.6% |
| Immigrants | Philippines | 31.5 /100 | #185 | Fair 84.6% |
| Immigrants | Congo | 29.7 /100 | #186 | Fair 84.6% |
| Costa Ricans | 29.6 /100 | #187 | Fair 84.6% |
| Taiwanese | 29.4 /100 | #188 | Fair 84.6% |
| Nigerians | 28.9 /100 | #189 | Fair 84.5% |
| Immigrants | Zaire | 25.8 /100 | #190 | Fair 84.5% |
| Hungarians | 24.8 /100 | #191 | Fair 84.5% |
| Scandinavians | 24.7 /100 | #192 | Fair 84.5% |
| Immigrants | Costa Rica | 23.9 /100 | #193 | Fair 84.5% |
| Immigrants | Afghanistan | 23.5 /100 | #194 | Fair 84.5% |
| Koreans | 23.2 /100 | #195 | Fair 84.5% |
Demographics Similar to Immigrants from Spain by In Labor Force | Age 30-34
In terms of in labor force | age 30-34, the demographic groups most similar to Immigrants from Spain are Immigrants from Western Africa (85.0%, a difference of 0.0%), Slavic (85.0%, a difference of 0.010%), Immigrants from Argentina (85.0%, a difference of 0.010%), Chinese (85.0%, a difference of 0.010%), and Immigrants from Israel (85.0%, a difference of 0.010%).
| Demographics | Rating | Rank | In Labor Force | Age 30-34 |
| Armenians | 92.2 /100 | #123 | Exceptional 85.0% |
| Australians | 92.0 /100 | #124 | Exceptional 85.0% |
| Immigrants | Jordan | 91.5 /100 | #125 | Exceptional 85.0% |
| Austrians | 90.9 /100 | #126 | Exceptional 85.0% |
| Slavs | 90.7 /100 | #127 | Exceptional 85.0% |
| Immigrants | Argentina | 90.6 /100 | #128 | Exceptional 85.0% |
| Immigrants | Western Africa | 90.2 /100 | #129 | Exceptional 85.0% |
| Immigrants | Spain | 90.0 /100 | #130 | Exceptional 85.0% |
| Chinese | 89.6 /100 | #131 | Excellent 85.0% |
| Immigrants | Israel | 89.5 /100 | #132 | Excellent 85.0% |
| New Zealanders | 89.5 /100 | #133 | Excellent 85.0% |
| Immigrants | Chile | 89.2 /100 | #134 | Excellent 85.0% |
| Immigrants | Asia | 88.9 /100 | #135 | Excellent 85.0% |
| Jordanians | 88.6 /100 | #136 | Excellent 85.0% |
| South Africans | 88.0 /100 | #137 | Excellent 85.0% |