Taiwanese vs Chilean In Labor Force | Age 35-44
COMPARE
Taiwanese
Chilean
In Labor Force | Age 35-44
In Labor Force | Age 35-44 Comparison
Taiwanese
Chileans
85.1%
IN LABOR FORCE | AGE 35-44
99.6/ 100
METRIC RATING
53rd/ 347
METRIC RANK
84.7%
IN LABOR FORCE | AGE 35-44
93.2/ 100
METRIC RATING
114th/ 347
METRIC RANK
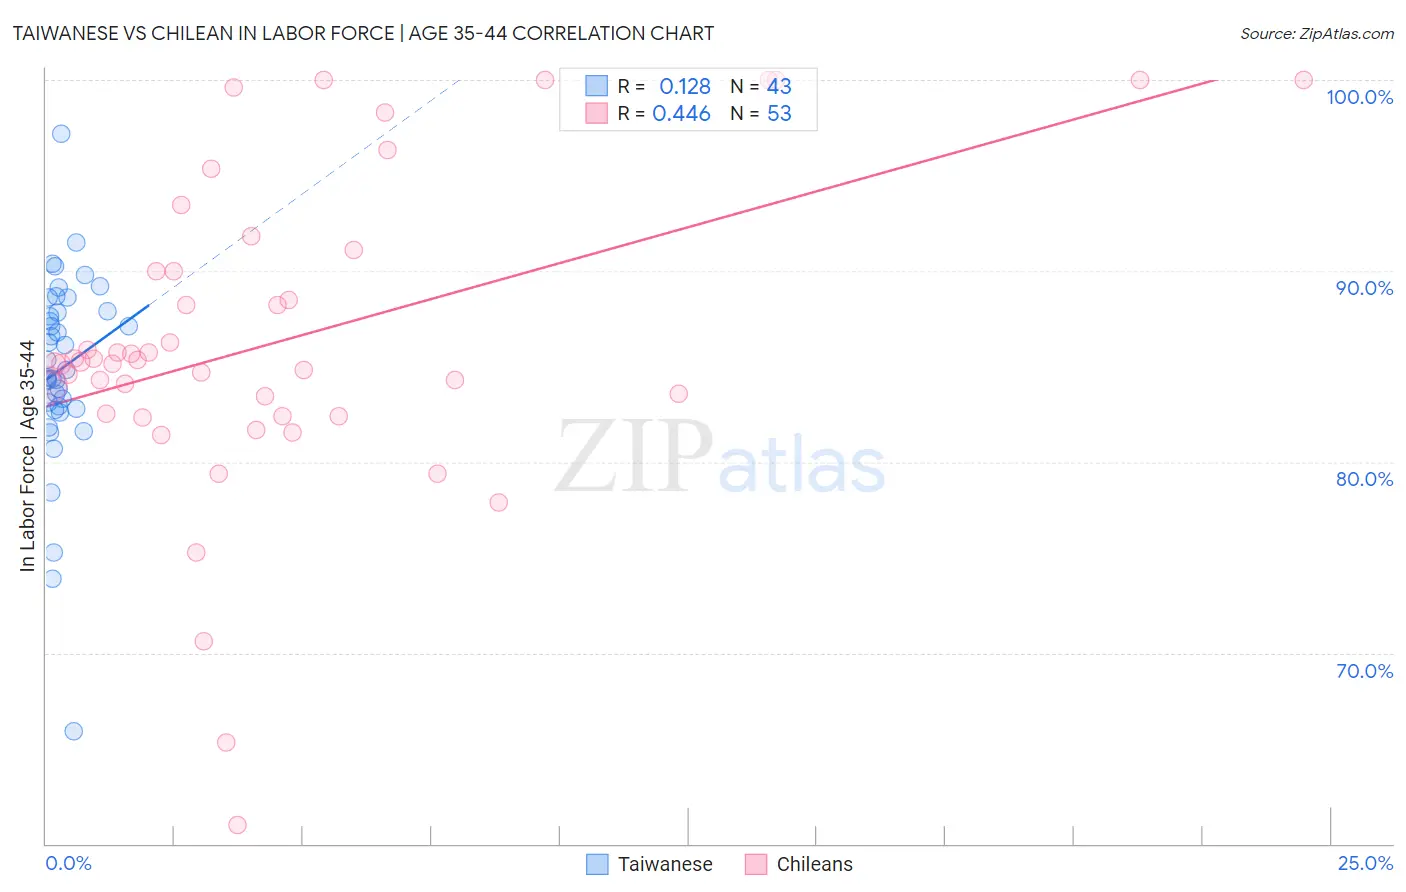
Taiwanese vs Chilean In Labor Force | Age 35-44 Correlation Chart
The statistical analysis conducted on geographies consisting of 31,713,459 people shows a poor positive correlation between the proportion of Taiwanese and labor force participation rate among population between the ages 35 and 44 in the United States with a correlation coefficient (R) of 0.128 and weighted average of 85.1%. Similarly, the statistical analysis conducted on geographies consisting of 256,599,929 people shows a moderate positive correlation between the proportion of Chileans and labor force participation rate among population between the ages 35 and 44 in the United States with a correlation coefficient (R) of 0.446 and weighted average of 84.7%, a difference of 0.46%.
In Labor Force | Age 35-44 Correlation Summary
| Measurement | Taiwanese | Chilean |
| Minimum | 65.9% | 61.0% |
| Maximum | 97.2% | 100.0% |
| Range | 31.3% | 39.0% |
| Mean | 84.9% | 86.4% |
| Median | 84.8% | 85.2% |
| Interquartile 25% (IQ1) | 82.8% | 82.5% |
| Interquartile 75% (IQ3) | 87.9% | 90.5% |
| Interquartile Range (IQR) | 5.1% | 8.1% |
| Standard Deviation (Sample) | 5.1% | 8.3% |
| Standard Deviation (Population) | 5.1% | 8.2% |
Similar Demographics by In Labor Force | Age 35-44
Demographics Similar to Taiwanese by In Labor Force | Age 35-44
In terms of in labor force | age 35-44, the demographic groups most similar to Taiwanese are Immigrants from Kenya (85.1%, a difference of 0.010%), Turkish (85.1%, a difference of 0.020%), Soviet Union (85.1%, a difference of 0.020%), Immigrants from Croatia (85.1%, a difference of 0.030%), and Immigrants from Albania (85.1%, a difference of 0.040%).
| Demographics | Rating | Rank | In Labor Force | Age 35-44 |
| Immigrants | Hong Kong | 99.8 /100 | #46 | Exceptional 85.2% |
| German Russians | 99.8 /100 | #47 | Exceptional 85.2% |
| Immigrants | Eritrea | 99.7 /100 | #48 | Exceptional 85.2% |
| Croatians | 99.7 /100 | #49 | Exceptional 85.2% |
| Thais | 99.7 /100 | #50 | Exceptional 85.2% |
| Immigrants | Albania | 99.7 /100 | #51 | Exceptional 85.1% |
| Immigrants | Kenya | 99.6 /100 | #52 | Exceptional 85.1% |
| Taiwanese | 99.6 /100 | #53 | Exceptional 85.1% |
| Turks | 99.5 /100 | #54 | Exceptional 85.1% |
| Soviet Union | 99.5 /100 | #55 | Exceptional 85.1% |
| Immigrants | Croatia | 99.5 /100 | #56 | Exceptional 85.1% |
| Chinese | 99.4 /100 | #57 | Exceptional 85.1% |
| Slovaks | 99.4 /100 | #58 | Exceptional 85.1% |
| Serbians | 99.4 /100 | #59 | Exceptional 85.1% |
| Albanians | 99.4 /100 | #60 | Exceptional 85.1% |
Demographics Similar to Chileans by In Labor Force | Age 35-44
In terms of in labor force | age 35-44, the demographic groups most similar to Chileans are Immigrants from Western Africa (84.7%, a difference of 0.0%), Uruguayan (84.7%, a difference of 0.0%), Bahamian (84.7%, a difference of 0.0%), Filipino (84.7%, a difference of 0.010%), and Ukrainian (84.7%, a difference of 0.010%).
| Demographics | Rating | Rank | In Labor Force | Age 35-44 |
| Immigrants | Romania | 94.7 /100 | #107 | Exceptional 84.8% |
| Immigrants | Argentina | 94.5 /100 | #108 | Exceptional 84.8% |
| Immigrants | Russia | 94.5 /100 | #109 | Exceptional 84.8% |
| Filipinos | 93.8 /100 | #110 | Exceptional 84.7% |
| Ukrainians | 93.5 /100 | #111 | Exceptional 84.7% |
| Immigrants | Western Africa | 93.4 /100 | #112 | Exceptional 84.7% |
| Uruguayans | 93.3 /100 | #113 | Exceptional 84.7% |
| Chileans | 93.2 /100 | #114 | Exceptional 84.7% |
| Bahamians | 93.2 /100 | #115 | Exceptional 84.7% |
| Immigrants | Egypt | 92.7 /100 | #116 | Exceptional 84.7% |
| Immigrants | China | 92.3 /100 | #117 | Exceptional 84.7% |
| Immigrants | Eastern Asia | 92.1 /100 | #118 | Exceptional 84.7% |
| Burmese | 91.8 /100 | #119 | Exceptional 84.7% |
| Immigrants | Northern Europe | 91.5 /100 | #120 | Exceptional 84.7% |
| Finns | 91.2 /100 | #121 | Exceptional 84.7% |