Armenian vs Canadian In Labor Force | Age 20-24
COMPARE
Armenian
Canadian
In Labor Force | Age 20-24
In Labor Force | Age 20-24 Comparison
Armenians
Canadians
72.5%
IN LABOR FORCE | AGE 20-24
0.0/ 100
METRIC RATING
300th/ 347
METRIC RANK
76.6%
IN LABOR FORCE | AGE 20-24
99.6/ 100
METRIC RATING
78th/ 347
METRIC RANK
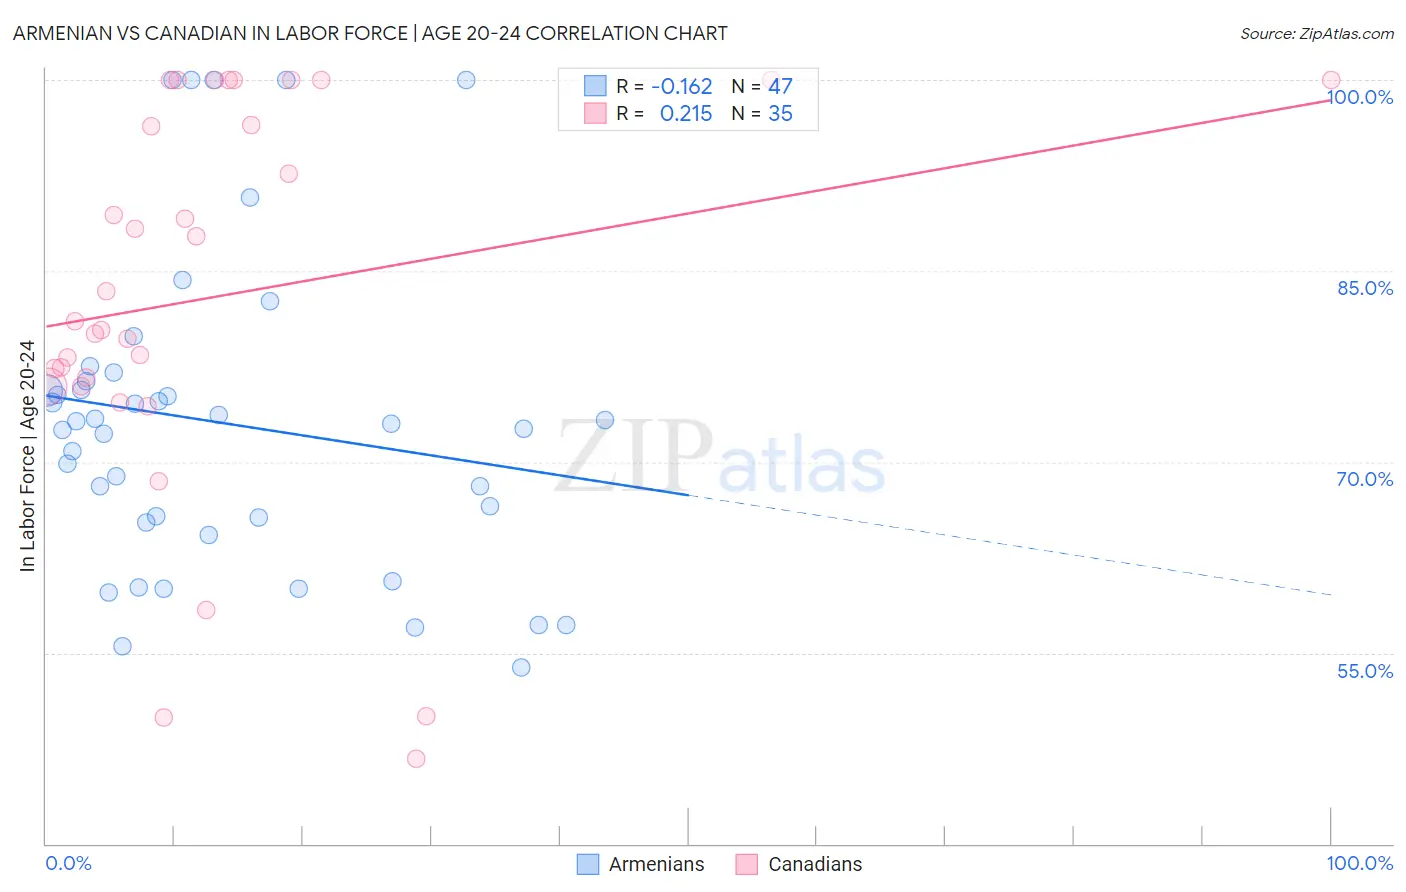
Armenian vs Canadian In Labor Force | Age 20-24 Correlation Chart
The statistical analysis conducted on geographies consisting of 310,817,761 people shows a poor negative correlation between the proportion of Armenians and labor force participation rate among population between the ages 20 and 24 in the United States with a correlation coefficient (R) of -0.162 and weighted average of 72.5%. Similarly, the statistical analysis conducted on geographies consisting of 437,221,793 people shows a weak positive correlation between the proportion of Canadians and labor force participation rate among population between the ages 20 and 24 in the United States with a correlation coefficient (R) of 0.215 and weighted average of 76.6%, a difference of 5.6%.
In Labor Force | Age 20-24 Correlation Summary
| Measurement | Armenian | Canadian |
| Minimum | 53.8% | 46.7% |
| Maximum | 100.0% | 100.0% |
| Range | 46.2% | 53.3% |
| Mean | 73.0% | 83.1% |
| Median | 73.0% | 81.1% |
| Interquartile 25% (IQ1) | 65.3% | 76.0% |
| Interquartile 75% (IQ3) | 76.4% | 100.0% |
| Interquartile Range (IQR) | 11.1% | 24.0% |
| Standard Deviation (Sample) | 12.3% | 15.3% |
| Standard Deviation (Population) | 12.2% | 15.0% |
Similar Demographics by In Labor Force | Age 20-24
Demographics Similar to Armenians by In Labor Force | Age 20-24
In terms of in labor force | age 20-24, the demographic groups most similar to Armenians are Iranian (72.6%, a difference of 0.020%), Israeli (72.6%, a difference of 0.070%), Cuban (72.5%, a difference of 0.070%), Native/Alaskan (72.4%, a difference of 0.16%), and Ecuadorian (72.4%, a difference of 0.17%).
| Demographics | Rating | Rank | In Labor Force | Age 20-24 |
| Immigrants | Belize | 0.0 /100 | #293 | Tragic 72.8% |
| Immigrants | Argentina | 0.0 /100 | #294 | Tragic 72.8% |
| Okinawans | 0.0 /100 | #295 | Tragic 72.7% |
| Jamaicans | 0.0 /100 | #296 | Tragic 72.7% |
| Central American Indians | 0.0 /100 | #297 | Tragic 72.7% |
| Israelis | 0.0 /100 | #298 | Tragic 72.6% |
| Iranians | 0.0 /100 | #299 | Tragic 72.6% |
| Armenians | 0.0 /100 | #300 | Tragic 72.5% |
| Cubans | 0.0 /100 | #301 | Tragic 72.5% |
| Natives/Alaskans | 0.0 /100 | #302 | Tragic 72.4% |
| Ecuadorians | 0.0 /100 | #303 | Tragic 72.4% |
| Immigrants | West Indies | 0.0 /100 | #304 | Tragic 72.4% |
| Immigrants | Singapore | 0.0 /100 | #305 | Tragic 72.4% |
| Immigrants | Jamaica | 0.0 /100 | #306 | Tragic 72.4% |
| Immigrants | Ecuador | 0.0 /100 | #307 | Tragic 72.3% |
Demographics Similar to Canadians by In Labor Force | Age 20-24
In terms of in labor force | age 20-24, the demographic groups most similar to Canadians are Immigrants from Cameroon (76.6%, a difference of 0.0%), Immigrants from Zaire (76.6%, a difference of 0.020%), Immigrants from Moldova (76.6%, a difference of 0.040%), Italian (76.5%, a difference of 0.050%), and Basque (76.5%, a difference of 0.060%).
| Demographics | Rating | Rank | In Labor Force | Age 20-24 |
| Northern Europeans | 99.8 /100 | #71 | Exceptional 76.8% |
| Guamanians/Chamorros | 99.8 /100 | #72 | Exceptional 76.7% |
| British | 99.8 /100 | #73 | Exceptional 76.7% |
| Cree | 99.7 /100 | #74 | Exceptional 76.6% |
| Immigrants | Middle Africa | 99.7 /100 | #75 | Exceptional 76.6% |
| Immigrants | Moldova | 99.6 /100 | #76 | Exceptional 76.6% |
| Immigrants | Cameroon | 99.6 /100 | #77 | Exceptional 76.6% |
| Canadians | 99.6 /100 | #78 | Exceptional 76.6% |
| Immigrants | Zaire | 99.6 /100 | #79 | Exceptional 76.6% |
| Italians | 99.6 /100 | #80 | Exceptional 76.5% |
| Basques | 99.5 /100 | #81 | Exceptional 76.5% |
| Hmong | 99.5 /100 | #82 | Exceptional 76.5% |
| Carpatho Rusyns | 99.4 /100 | #83 | Exceptional 76.5% |
| Austrians | 99.4 /100 | #84 | Exceptional 76.5% |
| Portuguese | 99.3 /100 | #85 | Exceptional 76.4% |