Norwegian vs Bermudan In Labor Force | Age 16-19
COMPARE
Norwegian
Bermudan
In Labor Force | Age 16-19
In Labor Force | Age 16-19 Comparison
Norwegians
Bermudans
46.2%
IN LABOR FORCE | AGE 16-19
100.0/ 100
METRIC RATING
2nd/ 347
METRIC RANK
36.9%
IN LABOR FORCE | AGE 16-19
69.3/ 100
METRIC RATING
163rd/ 347
METRIC RANK
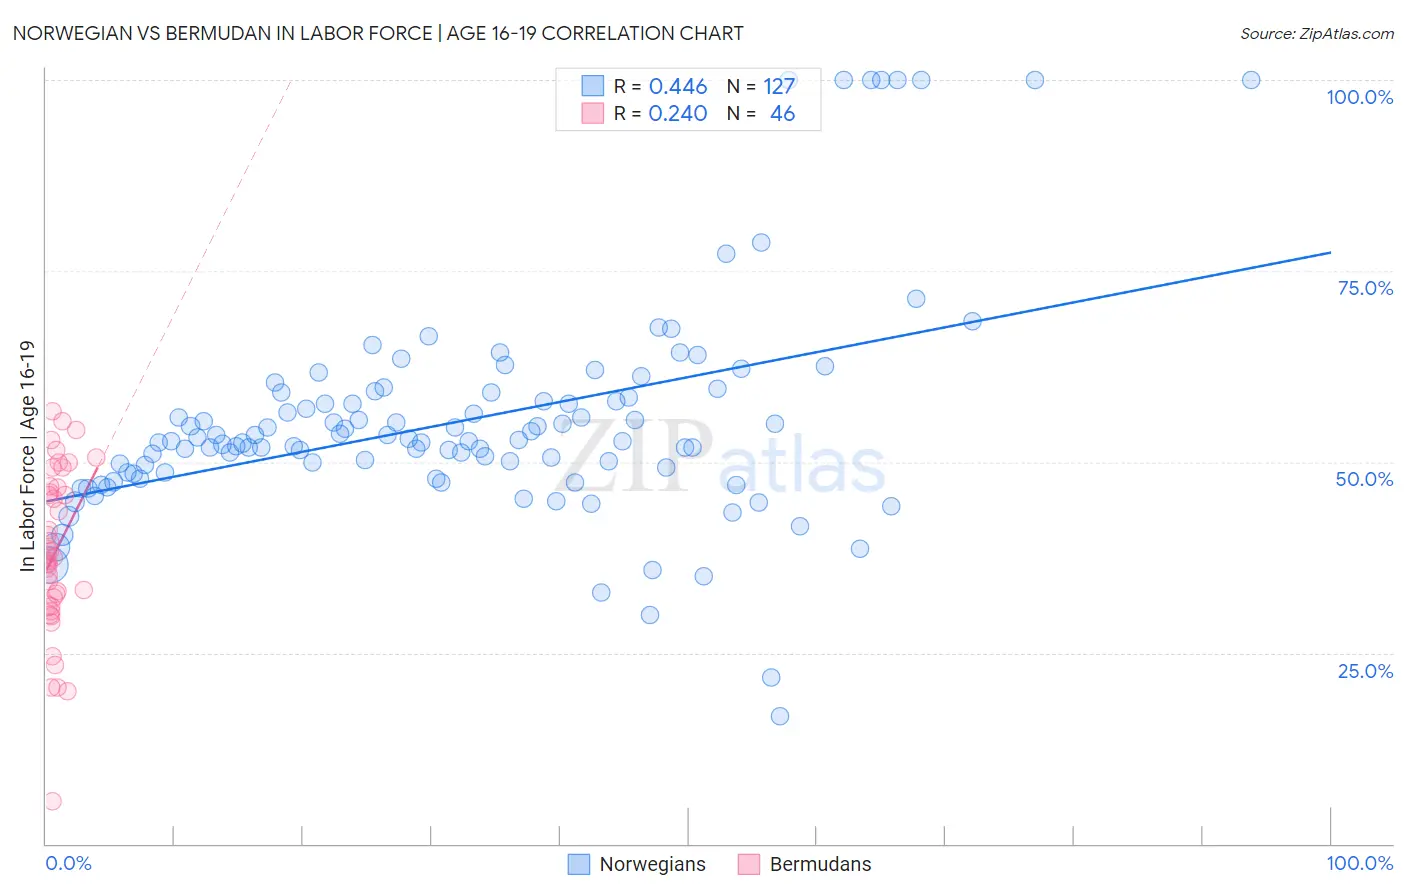
Norwegian vs Bermudan In Labor Force | Age 16-19 Correlation Chart
The statistical analysis conducted on geographies consisting of 530,724,351 people shows a moderate positive correlation between the proportion of Norwegians and labor force participation rate among population between the ages 16 and 19 in the United States with a correlation coefficient (R) of 0.446 and weighted average of 46.2%. Similarly, the statistical analysis conducted on geographies consisting of 55,701,640 people shows a weak positive correlation between the proportion of Bermudans and labor force participation rate among population between the ages 16 and 19 in the United States with a correlation coefficient (R) of 0.240 and weighted average of 36.9%, a difference of 25.0%.
In Labor Force | Age 16-19 Correlation Summary
| Measurement | Norwegian | Bermudan |
| Minimum | 16.7% | 5.6% |
| Maximum | 100.0% | 56.7% |
| Range | 83.3% | 51.1% |
| Mean | 55.4% | 38.2% |
| Median | 52.8% | 37.6% |
| Interquartile 25% (IQ1) | 48.6% | 31.2% |
| Interquartile 75% (IQ3) | 59.1% | 46.6% |
| Interquartile Range (IQR) | 10.5% | 15.4% |
| Standard Deviation (Sample) | 14.6% | 10.9% |
| Standard Deviation (Population) | 14.6% | 10.8% |
Similar Demographics by In Labor Force | Age 16-19
Demographics Similar to Norwegians by In Labor Force | Age 16-19
In terms of in labor force | age 16-19, the demographic groups most similar to Norwegians are Pennsylvania German (46.4%, a difference of 0.56%), Immigrants from Somalia (45.6%, a difference of 1.3%), Luxembourger (45.3%, a difference of 2.0%), Alaskan Athabascan (45.2%, a difference of 2.2%), and Somali (45.1%, a difference of 2.4%).
| Demographics | Rating | Rank | In Labor Force | Age 16-19 |
| Pennsylvania Germans | 100.0 /100 | #1 | Exceptional 46.4% |
| Norwegians | 100.0 /100 | #2 | Exceptional 46.2% |
| Immigrants | Somalia | 100.0 /100 | #3 | Exceptional 45.6% |
| Luxembourgers | 100.0 /100 | #4 | Exceptional 45.3% |
| Alaskan Athabascans | 100.0 /100 | #5 | Exceptional 45.2% |
| Somalis | 100.0 /100 | #6 | Exceptional 45.1% |
| Danes | 100.0 /100 | #7 | Exceptional 44.7% |
| Immigrants | Cabo Verde | 100.0 /100 | #8 | Exceptional 44.7% |
| Cape Verdeans | 100.0 /100 | #9 | Exceptional 44.5% |
| Germans | 100.0 /100 | #10 | Exceptional 44.2% |
| Swedes | 100.0 /100 | #11 | Exceptional 44.1% |
| Finns | 100.0 /100 | #12 | Exceptional 43.9% |
| Dutch | 100.0 /100 | #13 | Exceptional 43.8% |
| Chippewa | 100.0 /100 | #14 | Exceptional 43.8% |
| Slovenes | 100.0 /100 | #15 | Exceptional 43.7% |
Demographics Similar to Bermudans by In Labor Force | Age 16-19
In terms of in labor force | age 16-19, the demographic groups most similar to Bermudans are Immigrants from Jordan (36.9%, a difference of 0.010%), Immigrants from Kuwait (36.9%, a difference of 0.020%), Cambodian (37.0%, a difference of 0.13%), Yakama (36.9%, a difference of 0.14%), and Immigrants from Western Africa (36.9%, a difference of 0.15%).
| Demographics | Rating | Rank | In Labor Force | Age 16-19 |
| Kiowa | 80.4 /100 | #156 | Excellent 37.2% |
| Immigrants | Brazil | 76.5 /100 | #157 | Good 37.1% |
| Ute | 75.7 /100 | #158 | Good 37.1% |
| Yaqui | 74.4 /100 | #159 | Good 37.1% |
| Immigrants | Saudi Arabia | 73.9 /100 | #160 | Good 37.0% |
| Cambodians | 71.5 /100 | #161 | Good 37.0% |
| Immigrants | Jordan | 69.5 /100 | #162 | Good 36.9% |
| Bermudans | 69.3 /100 | #163 | Good 36.9% |
| Immigrants | Kuwait | 68.9 /100 | #164 | Good 36.9% |
| Yakama | 66.9 /100 | #165 | Good 36.9% |
| Immigrants | Western Africa | 66.7 /100 | #166 | Good 36.9% |
| Arabs | 63.6 /100 | #167 | Good 36.8% |
| Palestinians | 63.1 /100 | #168 | Good 36.8% |
| Immigrants | Latvia | 61.6 /100 | #169 | Good 36.8% |
| Immigrants | South Africa | 60.5 /100 | #170 | Good 36.8% |