Armenian vs Nicaraguan In Labor Force | Age 45-54
COMPARE
Armenian
Nicaraguan
In Labor Force | Age 45-54
In Labor Force | Age 45-54 Comparison
Armenians
Nicaraguans
82.5%
IN LABOR FORCE | AGE 45-54
23.2/ 100
METRIC RATING
191st/ 347
METRIC RANK
82.8%
IN LABOR FORCE | AGE 45-54
50.3/ 100
METRIC RATING
173rd/ 347
METRIC RANK
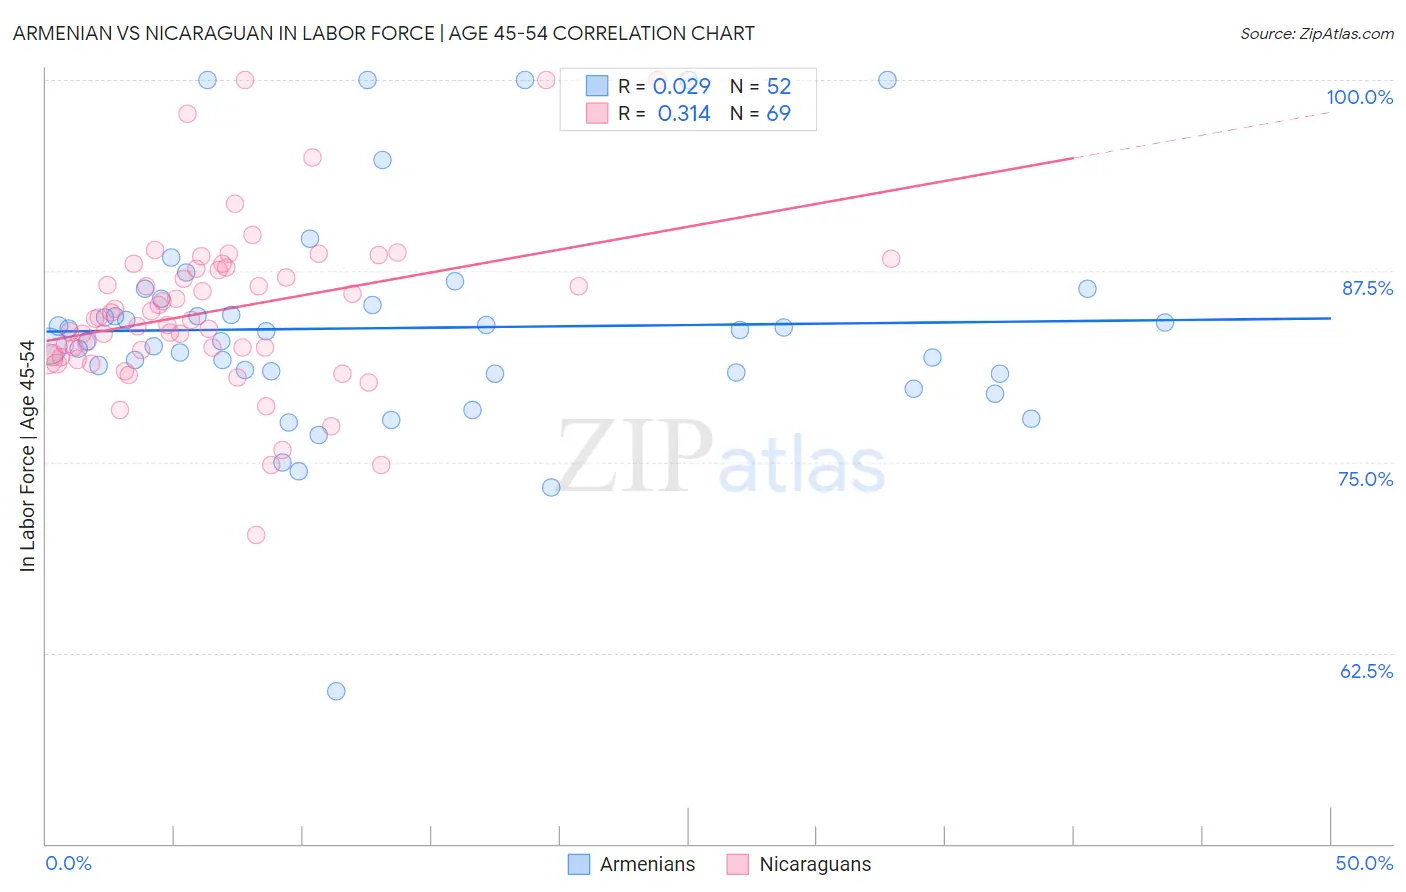
Armenian vs Nicaraguan In Labor Force | Age 45-54 Correlation Chart
The statistical analysis conducted on geographies consisting of 310,787,908 people shows no correlation between the proportion of Armenians and labor force participation rate among population between the ages 45 and 54 in the United States with a correlation coefficient (R) of 0.029 and weighted average of 82.5%. Similarly, the statistical analysis conducted on geographies consisting of 285,614,778 people shows a mild positive correlation between the proportion of Nicaraguans and labor force participation rate among population between the ages 45 and 54 in the United States with a correlation coefficient (R) of 0.314 and weighted average of 82.8%, a difference of 0.27%.
In Labor Force | Age 45-54 Correlation Summary
| Measurement | Armenian | Nicaraguan |
| Minimum | 60.0% | 70.2% |
| Maximum | 100.0% | 100.0% |
| Range | 40.0% | 29.8% |
| Mean | 83.8% | 84.9% |
| Median | 83.2% | 84.4% |
| Interquartile 25% (IQ1) | 80.8% | 81.9% |
| Interquartile 75% (IQ3) | 85.5% | 87.7% |
| Interquartile Range (IQR) | 4.7% | 5.8% |
| Standard Deviation (Sample) | 7.2% | 5.5% |
| Standard Deviation (Population) | 7.2% | 5.4% |
Demographics Similar to Armenians and Nicaraguans by In Labor Force | Age 45-54
In terms of in labor force | age 45-54, the demographic groups most similar to Armenians are Syrian (82.6%, a difference of 0.030%), British (82.6%, a difference of 0.030%), Immigrants from Iraq (82.5%, a difference of 0.030%), Immigrants from Costa Rica (82.6%, a difference of 0.060%), and South African (82.6%, a difference of 0.060%). Similarly, the demographic groups most similar to Nicaraguans are Costa Rican (82.8%, a difference of 0.0%), Icelander (82.8%, a difference of 0.010%), Immigrants from Liberia (82.7%, a difference of 0.020%), Northern European (82.7%, a difference of 0.030%), and Immigrants from Nicaragua (82.7%, a difference of 0.050%).
| Demographics | Rating | Rank | In Labor Force | Age 45-54 |
| Icelanders | 51.8 /100 | #172 | Average 82.8% |
| Nicaraguans | 50.3 /100 | #173 | Average 82.8% |
| Costa Ricans | 50.0 /100 | #174 | Average 82.8% |
| Immigrants | Liberia | 47.9 /100 | #175 | Average 82.7% |
| Northern Europeans | 46.9 /100 | #176 | Average 82.7% |
| Immigrants | Nicaragua | 44.6 /100 | #177 | Average 82.7% |
| Nigerians | 40.5 /100 | #178 | Average 82.7% |
| Immigrants | Switzerland | 39.4 /100 | #179 | Fair 82.7% |
| Hungarians | 38.0 /100 | #180 | Fair 82.7% |
| Israelis | 37.7 /100 | #181 | Fair 82.7% |
| Immigrants | Hungary | 37.1 /100 | #182 | Fair 82.7% |
| New Zealanders | 32.7 /100 | #183 | Fair 82.6% |
| Europeans | 32.6 /100 | #184 | Fair 82.6% |
| Immigrants | England | 32.2 /100 | #185 | Fair 82.6% |
| Irish | 29.2 /100 | #186 | Fair 82.6% |
| Immigrants | Costa Rica | 28.3 /100 | #187 | Fair 82.6% |
| South Africans | 28.0 /100 | #188 | Fair 82.6% |
| Syrians | 26.0 /100 | #189 | Fair 82.6% |
| British | 25.7 /100 | #190 | Fair 82.6% |
| Armenians | 23.2 /100 | #191 | Fair 82.5% |
| Immigrants | Iraq | 20.9 /100 | #192 | Fair 82.5% |