Polish vs Immigrants from Czechoslovakia In Labor Force | Age 45-54
COMPARE
Polish
Immigrants from Czechoslovakia
In Labor Force | Age 45-54
In Labor Force | Age 45-54 Comparison
Poles
Immigrants from Czechoslovakia
83.6%
IN LABOR FORCE | AGE 45-54
98.7/ 100
METRIC RATING
52nd/ 347
METRIC RANK
83.4%
IN LABOR FORCE | AGE 45-54
97.1/ 100
METRIC RATING
73rd/ 347
METRIC RANK
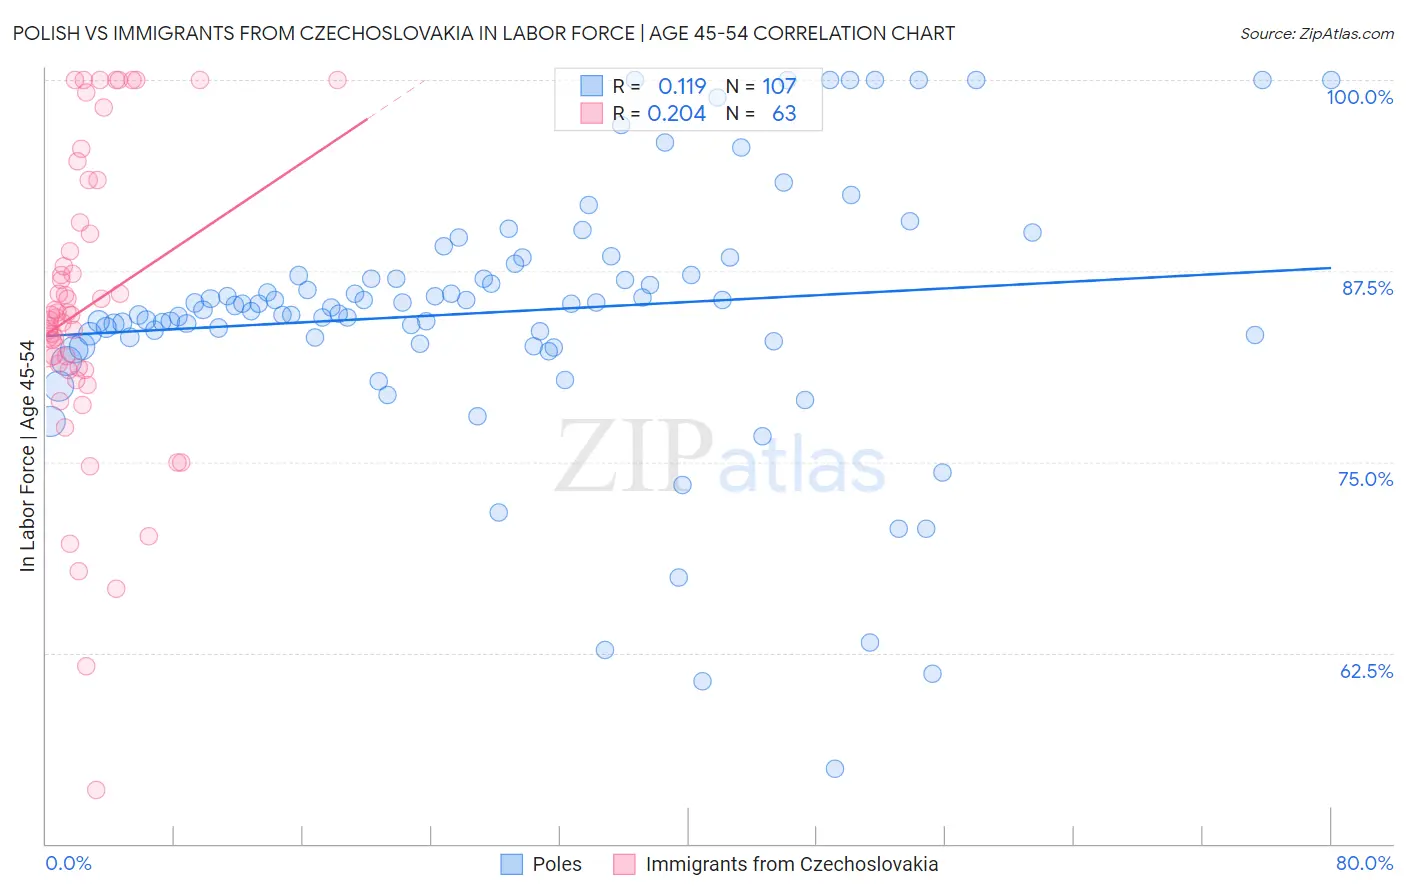
Polish vs Immigrants from Czechoslovakia In Labor Force | Age 45-54 Correlation Chart
The statistical analysis conducted on geographies consisting of 559,827,067 people shows a poor positive correlation between the proportion of Poles and labor force participation rate among population between the ages 45 and 54 in the United States with a correlation coefficient (R) of 0.119 and weighted average of 83.6%. Similarly, the statistical analysis conducted on geographies consisting of 195,437,318 people shows a weak positive correlation between the proportion of Immigrants from Czechoslovakia and labor force participation rate among population between the ages 45 and 54 in the United States with a correlation coefficient (R) of 0.204 and weighted average of 83.4%, a difference of 0.19%.
In Labor Force | Age 45-54 Correlation Summary
| Measurement | Polish | Immigrants from Czechoslovakia |
| Minimum | 54.9% | 53.5% |
| Maximum | 100.0% | 100.0% |
| Range | 45.1% | 46.5% |
| Mean | 84.8% | 85.1% |
| Median | 85.1% | 84.6% |
| Interquartile 25% (IQ1) | 82.9% | 81.0% |
| Interquartile 75% (IQ3) | 87.2% | 90.7% |
| Interquartile Range (IQR) | 4.3% | 9.6% |
| Standard Deviation (Sample) | 8.5% | 9.9% |
| Standard Deviation (Population) | 8.4% | 9.8% |
Similar Demographics by In Labor Force | Age 45-54
Demographics Similar to Poles by In Labor Force | Age 45-54
In terms of in labor force | age 45-54, the demographic groups most similar to Poles are Immigrants from Turkey (83.6%, a difference of 0.0%), Peruvian (83.6%, a difference of 0.0%), Immigrants from Greece (83.6%, a difference of 0.010%), Somali (83.5%, a difference of 0.010%), and Macedonian (83.5%, a difference of 0.020%).
| Demographics | Rating | Rank | In Labor Force | Age 45-54 |
| Immigrants | Hong Kong | 99.1 /100 | #45 | Exceptional 83.6% |
| Lithuanians | 99.1 /100 | #46 | Exceptional 83.6% |
| Croatians | 99.0 /100 | #47 | Exceptional 83.6% |
| Immigrants | Poland | 99.0 /100 | #48 | Exceptional 83.6% |
| Immigrants | Morocco | 99.0 /100 | #49 | Exceptional 83.6% |
| Immigrants | Greece | 98.8 /100 | #50 | Exceptional 83.6% |
| Immigrants | Turkey | 98.8 /100 | #51 | Exceptional 83.6% |
| Poles | 98.7 /100 | #52 | Exceptional 83.6% |
| Peruvians | 98.7 /100 | #53 | Exceptional 83.6% |
| Somalis | 98.7 /100 | #54 | Exceptional 83.5% |
| Macedonians | 98.7 /100 | #55 | Exceptional 83.5% |
| Immigrants | Peru | 98.6 /100 | #56 | Exceptional 83.5% |
| Paraguayans | 98.5 /100 | #57 | Exceptional 83.5% |
| Eastern Europeans | 98.5 /100 | #58 | Exceptional 83.5% |
| Bhutanese | 98.3 /100 | #59 | Exceptional 83.5% |
Demographics Similar to Immigrants from Czechoslovakia by In Labor Force | Age 45-54
In terms of in labor force | age 45-54, the demographic groups most similar to Immigrants from Czechoslovakia are Serbian (83.4%, a difference of 0.010%), Immigrants from Somalia (83.4%, a difference of 0.010%), Estonian (83.4%, a difference of 0.010%), Immigrants from Latvia (83.4%, a difference of 0.020%), and Colombian (83.4%, a difference of 0.020%).
| Demographics | Rating | Rank | In Labor Force | Age 45-54 |
| Asians | 97.7 /100 | #66 | Exceptional 83.4% |
| Chileans | 97.7 /100 | #67 | Exceptional 83.4% |
| Immigrants | Colombia | 97.6 /100 | #68 | Exceptional 83.4% |
| Taiwanese | 97.5 /100 | #69 | Exceptional 83.4% |
| Immigrants | Latvia | 97.4 /100 | #70 | Exceptional 83.4% |
| Colombians | 97.3 /100 | #71 | Exceptional 83.4% |
| Serbians | 97.2 /100 | #72 | Exceptional 83.4% |
| Immigrants | Czechoslovakia | 97.1 /100 | #73 | Exceptional 83.4% |
| Immigrants | Somalia | 96.9 /100 | #74 | Exceptional 83.4% |
| Estonians | 96.9 /100 | #75 | Exceptional 83.4% |
| Russians | 96.8 /100 | #76 | Exceptional 83.4% |
| Cubans | 96.7 /100 | #77 | Exceptional 83.4% |
| Immigrants | Egypt | 96.6 /100 | #78 | Exceptional 83.4% |
| Belgians | 96.5 /100 | #79 | Exceptional 83.4% |
| Immigrants | Croatia | 96.5 /100 | #80 | Exceptional 83.4% |