Sierra Leonean vs Dutch In Labor Force | Age 30-34
COMPARE
Sierra Leonean
Dutch
In Labor Force | Age 30-34
In Labor Force | Age 30-34 Comparison
Sierra Leoneans
Dutch
86.0%
IN LABOR FORCE | AGE 30-34
100.0/ 100
METRIC RATING
19th/ 347
METRIC RANK
84.5%
IN LABOR FORCE | AGE 30-34
20.2/ 100
METRIC RATING
198th/ 347
METRIC RANK
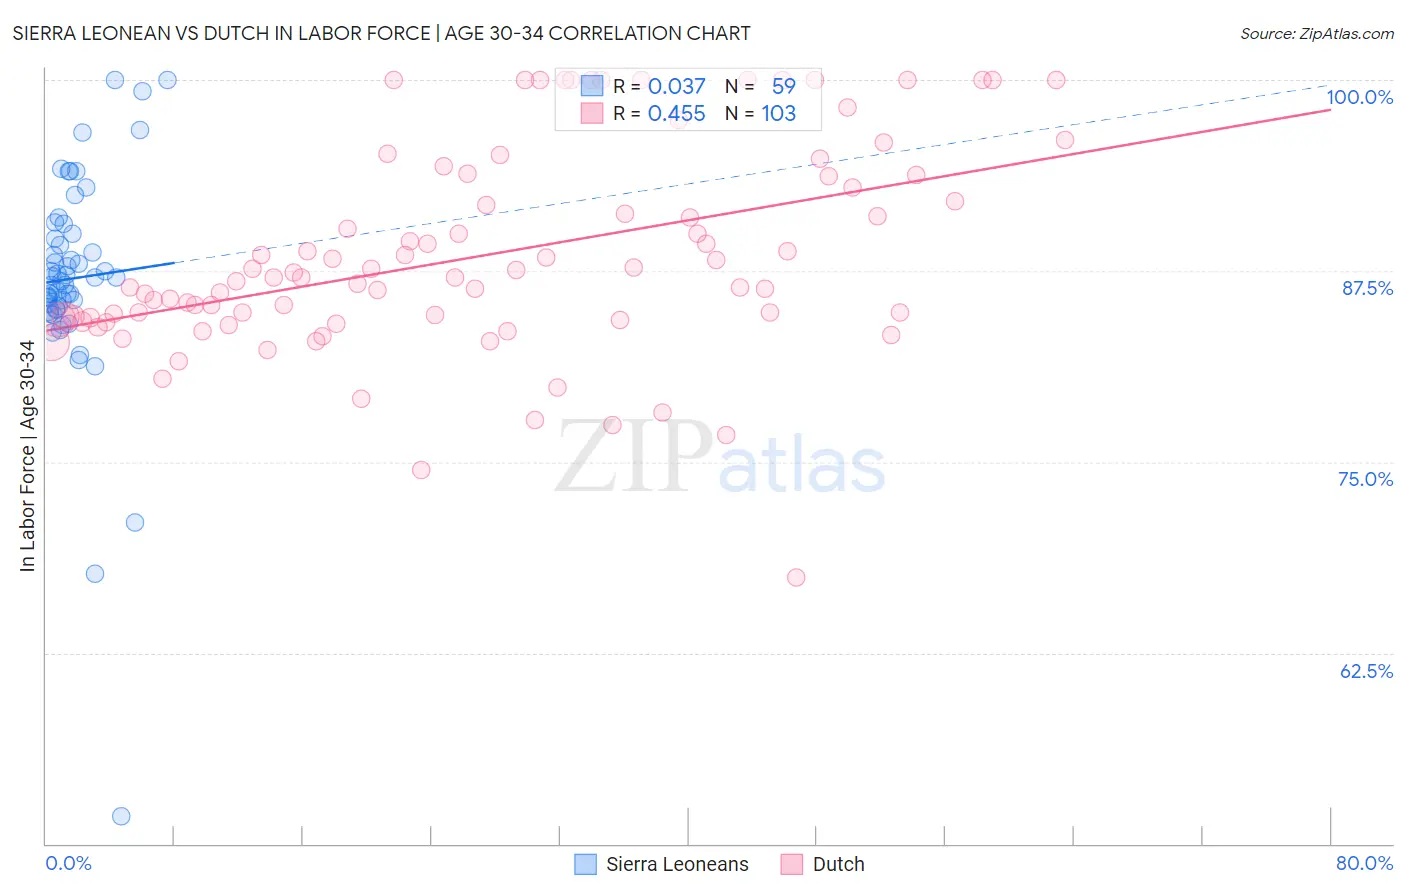
Sierra Leonean vs Dutch In Labor Force | Age 30-34 Correlation Chart
The statistical analysis conducted on geographies consisting of 83,346,965 people shows no correlation between the proportion of Sierra Leoneans and labor force participation rate among population between the ages 30 and 34 in the United States with a correlation coefficient (R) of 0.037 and weighted average of 86.0%. Similarly, the statistical analysis conducted on geographies consisting of 553,365,040 people shows a moderate positive correlation between the proportion of Dutch and labor force participation rate among population between the ages 30 and 34 in the United States with a correlation coefficient (R) of 0.455 and weighted average of 84.5%, a difference of 1.8%.
In Labor Force | Age 30-34 Correlation Summary
| Measurement | Sierra Leonean | Dutch |
| Minimum | 51.8% | 67.4% |
| Maximum | 100.0% | 100.0% |
| Range | 48.2% | 32.6% |
| Mean | 87.0% | 88.5% |
| Median | 87.1% | 87.0% |
| Interquartile 25% (IQ1) | 85.0% | 84.3% |
| Interquartile 75% (IQ3) | 89.9% | 93.7% |
| Interquartile Range (IQR) | 4.9% | 9.4% |
| Standard Deviation (Sample) | 7.3% | 6.7% |
| Standard Deviation (Population) | 7.2% | 6.7% |
Similar Demographics by In Labor Force | Age 30-34
Demographics Similar to Sierra Leoneans by In Labor Force | Age 30-34
In terms of in labor force | age 30-34, the demographic groups most similar to Sierra Leoneans are Bulgarian (86.0%, a difference of 0.010%), Immigrants from Bulgaria (86.0%, a difference of 0.010%), Bermudan (85.9%, a difference of 0.030%), Estonian (85.9%, a difference of 0.030%), and Immigrants from Eritrea (85.9%, a difference of 0.040%).
| Demographics | Rating | Rank | In Labor Force | Age 30-34 |
| Bolivians | 100.0 /100 | #12 | Exceptional 86.1% |
| Immigrants | Croatia | 100.0 /100 | #13 | Exceptional 86.1% |
| Immigrants | Cabo Verde | 100.0 /100 | #14 | Exceptional 86.1% |
| Immigrants | Albania | 100.0 /100 | #15 | Exceptional 86.1% |
| Latvians | 100.0 /100 | #16 | Exceptional 86.0% |
| Immigrants | Cameroon | 100.0 /100 | #17 | Exceptional 86.0% |
| Immigrants | Sierra Leone | 100.0 /100 | #18 | Exceptional 86.0% |
| Sierra Leoneans | 100.0 /100 | #19 | Exceptional 86.0% |
| Bulgarians | 100.0 /100 | #20 | Exceptional 86.0% |
| Immigrants | Bulgaria | 100.0 /100 | #21 | Exceptional 86.0% |
| Bermudans | 100.0 /100 | #22 | Exceptional 85.9% |
| Estonians | 100.0 /100 | #23 | Exceptional 85.9% |
| Immigrants | Eritrea | 100.0 /100 | #24 | Exceptional 85.9% |
| Immigrants | North Macedonia | 100.0 /100 | #25 | Exceptional 85.9% |
| Immigrants | Eastern Africa | 100.0 /100 | #26 | Exceptional 85.9% |
Demographics Similar to Dutch by In Labor Force | Age 30-34
In terms of in labor force | age 30-34, the demographic groups most similar to Dutch are Immigrants from Thailand (84.5%, a difference of 0.010%), Subsaharan African (84.5%, a difference of 0.010%), Immigrants from Syria (84.5%, a difference of 0.020%), Trinidadian and Tobagonian (84.5%, a difference of 0.020%), and Immigrants from West Indies (84.5%, a difference of 0.020%).
| Demographics | Rating | Rank | In Labor Force | Age 30-34 |
| Hungarians | 24.8 /100 | #191 | Fair 84.5% |
| Scandinavians | 24.7 /100 | #192 | Fair 84.5% |
| Immigrants | Costa Rica | 23.9 /100 | #193 | Fair 84.5% |
| Immigrants | Afghanistan | 23.5 /100 | #194 | Fair 84.5% |
| Koreans | 23.2 /100 | #195 | Fair 84.5% |
| British | 22.9 /100 | #196 | Fair 84.5% |
| Immigrants | Syria | 21.9 /100 | #197 | Fair 84.5% |
| Dutch | 20.2 /100 | #198 | Fair 84.5% |
| Immigrants | Thailand | 19.1 /100 | #199 | Poor 84.5% |
| Sub-Saharan Africans | 19.0 /100 | #200 | Poor 84.5% |
| Trinidadians and Tobagonians | 18.2 /100 | #201 | Poor 84.5% |
| Immigrants | West Indies | 18.1 /100 | #202 | Poor 84.5% |
| Canadians | 15.4 /100 | #203 | Poor 84.4% |
| Ecuadorians | 14.2 /100 | #204 | Poor 84.4% |
| French | 13.8 /100 | #205 | Poor 84.4% |