Sierra Leonean vs Albanian Bachelor's Degree
COMPARE
Sierra Leonean
Albanian
Bachelor's Degree
Bachelor's Degree Comparison
Sierra Leoneans
Albanians
40.1%
BACHELOR'S DEGREE
92.2/ 100
METRIC RATING
130th/ 347
METRIC RANK
40.9%
BACHELOR'S DEGREE
96.5/ 100
METRIC RATING
110th/ 347
METRIC RANK
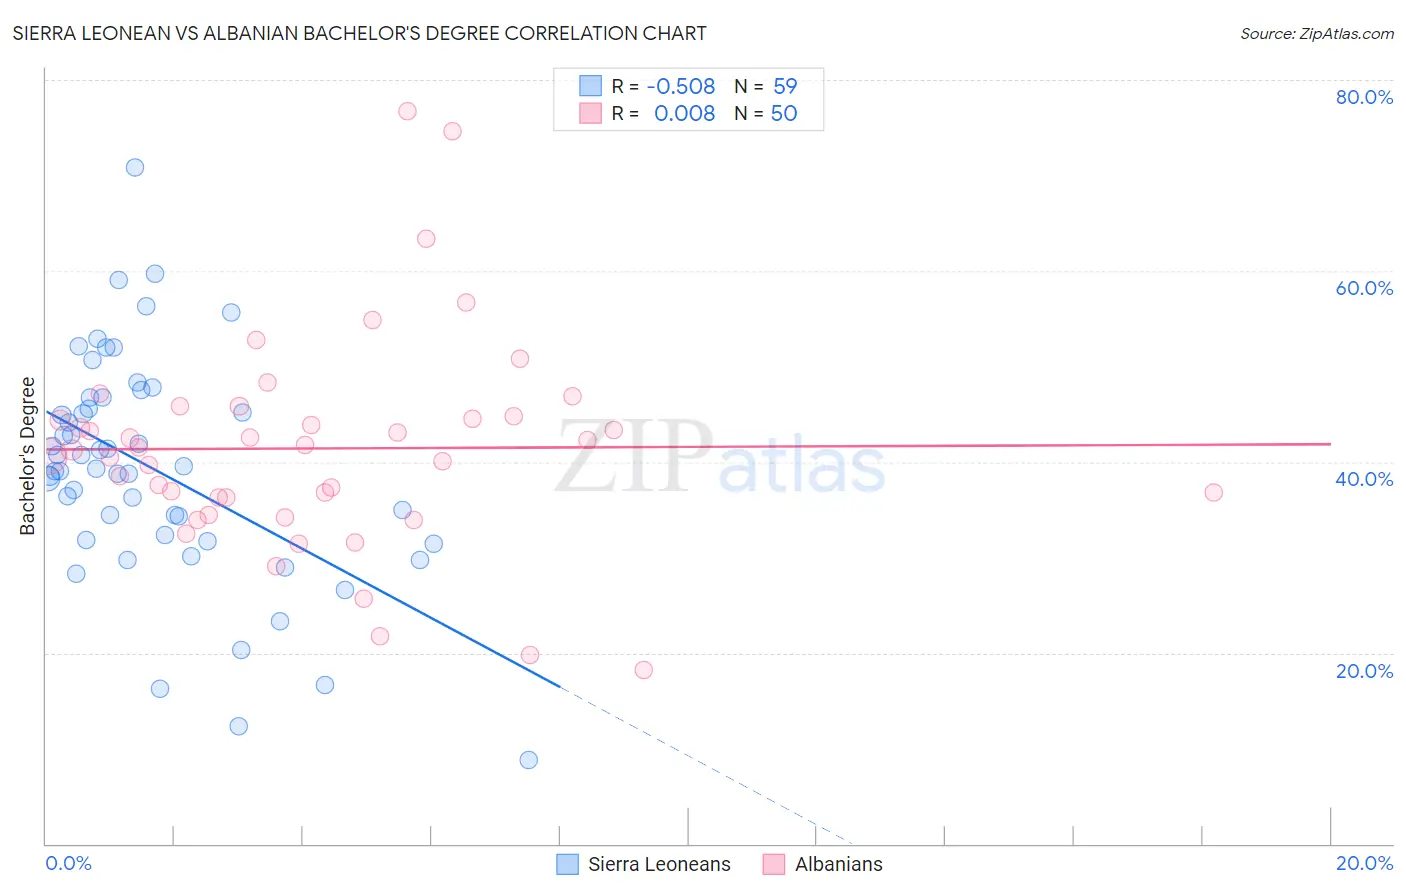
Sierra Leonean vs Albanian Bachelor's Degree Correlation Chart
The statistical analysis conducted on geographies consisting of 83,362,711 people shows a substantial negative correlation between the proportion of Sierra Leoneans and percentage of population with at least bachelor's degree education in the United States with a correlation coefficient (R) of -0.508 and weighted average of 40.1%. Similarly, the statistical analysis conducted on geographies consisting of 193,245,507 people shows no correlation between the proportion of Albanians and percentage of population with at least bachelor's degree education in the United States with a correlation coefficient (R) of 0.008 and weighted average of 40.9%, a difference of 1.9%.
Bachelor's Degree Correlation Summary
| Measurement | Sierra Leonean | Albanian |
| Minimum | 8.8% | 18.2% |
| Maximum | 70.8% | 76.7% |
| Range | 62.1% | 58.4% |
| Mean | 39.2% | 41.4% |
| Median | 39.3% | 41.4% |
| Interquartile 25% (IQ1) | 31.8% | 36.3% |
| Interquartile 75% (IQ3) | 46.8% | 44.8% |
| Interquartile Range (IQR) | 15.0% | 8.5% |
| Standard Deviation (Sample) | 11.8% | 11.2% |
| Standard Deviation (Population) | 11.7% | 11.1% |
Demographics Similar to Sierra Leoneans and Albanians by Bachelor's Degree
In terms of bachelor's degree, the demographic groups most similar to Sierra Leoneans are Serbian (40.1%, a difference of 0.070%), Immigrants from Venezuela (40.2%, a difference of 0.24%), Immigrants from Jordan (40.3%, a difference of 0.42%), Immigrants from Eastern Africa (40.4%, a difference of 0.70%), and British (40.4%, a difference of 0.75%). Similarly, the demographic groups most similar to Albanians are Immigrants from Chile (40.8%, a difference of 0.050%), Ugandan (40.8%, a difference of 0.090%), Brazilian (40.8%, a difference of 0.14%), Afghan (40.8%, a difference of 0.16%), and Palestinian (40.7%, a difference of 0.40%).
| Demographics | Rating | Rank | Bachelor's Degree |
| Albanians | 96.5 /100 | #110 | Exceptional 40.9% |
| Immigrants | Chile | 96.4 /100 | #111 | Exceptional 40.8% |
| Ugandans | 96.3 /100 | #112 | Exceptional 40.8% |
| Brazilians | 96.3 /100 | #113 | Exceptional 40.8% |
| Afghans | 96.2 /100 | #114 | Exceptional 40.8% |
| Palestinians | 95.8 /100 | #115 | Exceptional 40.7% |
| Immigrants | Uganda | 95.7 /100 | #116 | Exceptional 40.7% |
| Austrians | 95.5 /100 | #117 | Exceptional 40.6% |
| Croatians | 95.5 /100 | #118 | Exceptional 40.6% |
| Immigrants | Syria | 94.9 /100 | #119 | Exceptional 40.5% |
| Venezuelans | 94.7 /100 | #120 | Exceptional 40.5% |
| Moroccans | 94.6 /100 | #121 | Exceptional 40.5% |
| Immigrants | Albania | 94.4 /100 | #122 | Exceptional 40.4% |
| Lebanese | 94.3 /100 | #123 | Exceptional 40.4% |
| Immigrants | Eritrea | 94.3 /100 | #124 | Exceptional 40.4% |
| British | 94.2 /100 | #125 | Exceptional 40.4% |
| Immigrants | Eastern Africa | 94.1 /100 | #126 | Exceptional 40.4% |
| Immigrants | Jordan | 93.4 /100 | #127 | Exceptional 40.3% |
| Immigrants | Venezuela | 92.9 /100 | #128 | Exceptional 40.2% |
| Serbians | 92.4 /100 | #129 | Exceptional 40.1% |
| Sierra Leoneans | 92.2 /100 | #130 | Exceptional 40.1% |