Albanian vs Kiowa In Labor Force | Age 30-34
COMPARE
Albanian
Kiowa
In Labor Force | Age 30-34
In Labor Force | Age 30-34 Comparison
Albanians
Kiowa
85.7%
IN LABOR FORCE | AGE 30-34
99.9/ 100
METRIC RATING
36th/ 347
METRIC RANK
79.8%
IN LABOR FORCE | AGE 30-34
0.0/ 100
METRIC RATING
332nd/ 347
METRIC RANK
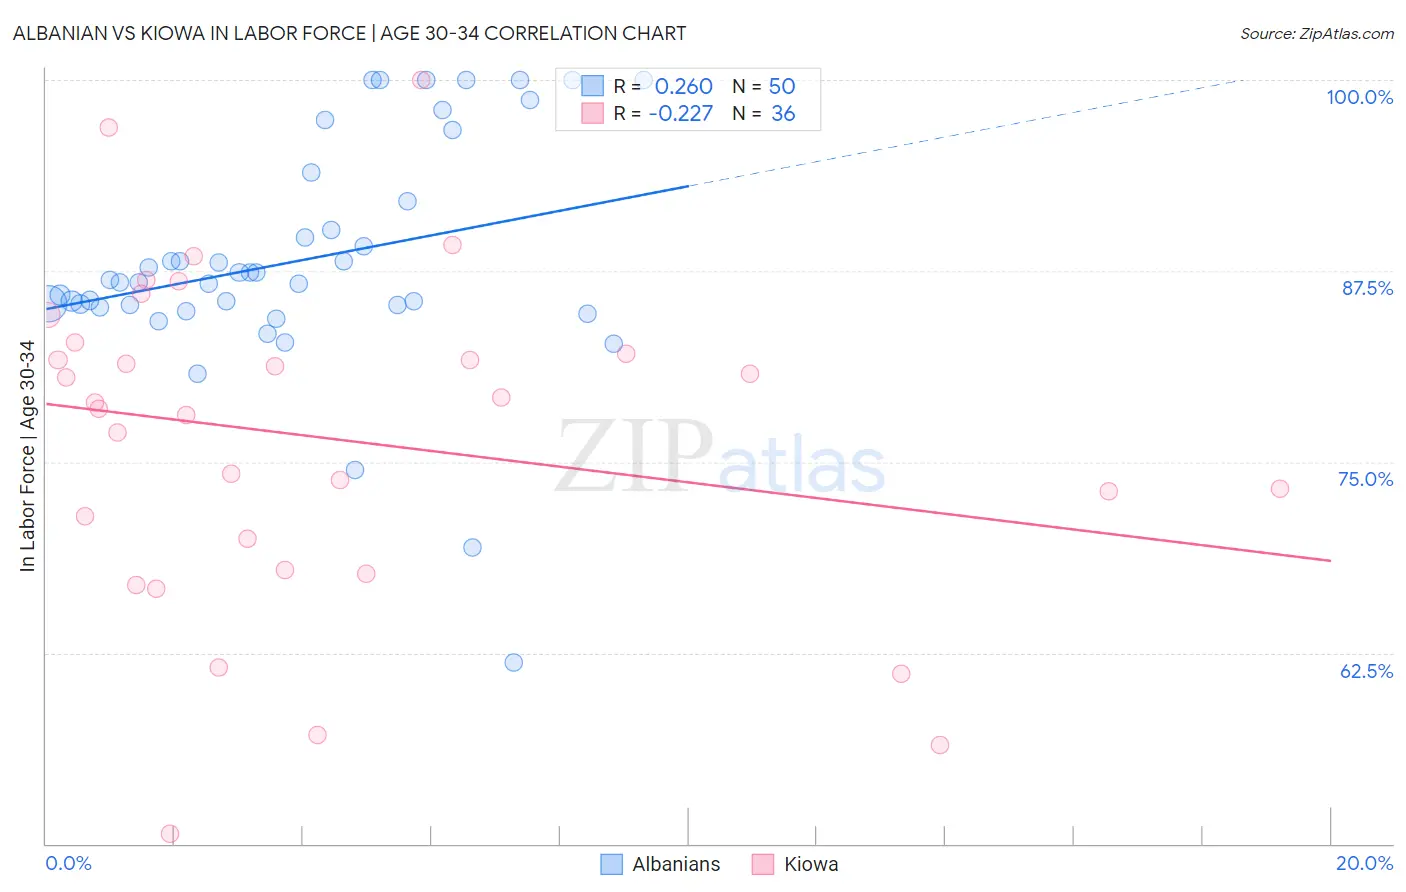
Albanian vs Kiowa In Labor Force | Age 30-34 Correlation Chart
The statistical analysis conducted on geographies consisting of 193,201,711 people shows a weak positive correlation between the proportion of Albanians and labor force participation rate among population between the ages 30 and 34 in the United States with a correlation coefficient (R) of 0.260 and weighted average of 85.7%. Similarly, the statistical analysis conducted on geographies consisting of 56,095,745 people shows a weak negative correlation between the proportion of Kiowa and labor force participation rate among population between the ages 30 and 34 in the United States with a correlation coefficient (R) of -0.227 and weighted average of 79.8%, a difference of 7.4%.
In Labor Force | Age 30-34 Correlation Summary
| Measurement | Albanian | Kiowa |
| Minimum | 61.9% | 50.7% |
| Maximum | 100.0% | 100.0% |
| Range | 38.1% | 49.3% |
| Mean | 88.2% | 76.5% |
| Median | 86.8% | 78.7% |
| Interquartile 25% (IQ1) | 85.3% | 69.0% |
| Interquartile 75% (IQ3) | 92.1% | 82.5% |
| Interquartile Range (IQR) | 6.8% | 13.5% |
| Standard Deviation (Sample) | 7.7% | 11.0% |
| Standard Deviation (Population) | 7.6% | 10.8% |
Similar Demographics by In Labor Force | Age 30-34
Demographics Similar to Albanians by In Labor Force | Age 30-34
In terms of in labor force | age 30-34, the demographic groups most similar to Albanians are Serbian (85.8%, a difference of 0.0%), Immigrants from Bosnia and Herzegovina (85.8%, a difference of 0.010%), Ugandan (85.8%, a difference of 0.010%), Norwegian (85.7%, a difference of 0.010%), and Immigrants from Greece (85.7%, a difference of 0.010%).
| Demographics | Rating | Rank | In Labor Force | Age 30-34 |
| Tsimshian | 100.0 /100 | #29 | Exceptional 85.8% |
| Immigrants | Hong Kong | 100.0 /100 | #30 | Exceptional 85.8% |
| Paraguayans | 99.9 /100 | #31 | Exceptional 85.8% |
| Cypriots | 99.9 /100 | #32 | Exceptional 85.8% |
| Immigrants | Bosnia and Herzegovina | 99.9 /100 | #33 | Exceptional 85.8% |
| Ugandans | 99.9 /100 | #34 | Exceptional 85.8% |
| Serbians | 99.9 /100 | #35 | Exceptional 85.8% |
| Albanians | 99.9 /100 | #36 | Exceptional 85.7% |
| Norwegians | 99.9 /100 | #37 | Exceptional 85.7% |
| Immigrants | Greece | 99.9 /100 | #38 | Exceptional 85.7% |
| Eastern Europeans | 99.9 /100 | #39 | Exceptional 85.7% |
| Turks | 99.9 /100 | #40 | Exceptional 85.7% |
| Immigrants | Italy | 99.9 /100 | #41 | Exceptional 85.7% |
| Zimbabweans | 99.8 /100 | #42 | Exceptional 85.6% |
| Immigrants | Lithuania | 99.8 /100 | #43 | Exceptional 85.6% |
Demographics Similar to Kiowa by In Labor Force | Age 30-34
In terms of in labor force | age 30-34, the demographic groups most similar to Kiowa are Houma (79.9%, a difference of 0.11%), Inupiat (79.7%, a difference of 0.12%), Pueblo (80.0%, a difference of 0.28%), Creek (80.4%, a difference of 0.68%), and Sioux (80.4%, a difference of 0.69%).
| Demographics | Rating | Rank | In Labor Force | Age 30-34 |
| Dutch West Indians | 0.0 /100 | #325 | Tragic 81.0% |
| Seminole | 0.0 /100 | #326 | Tragic 80.8% |
| Colville | 0.0 /100 | #327 | Tragic 80.7% |
| Sioux | 0.0 /100 | #328 | Tragic 80.4% |
| Creek | 0.0 /100 | #329 | Tragic 80.4% |
| Pueblo | 0.0 /100 | #330 | Tragic 80.0% |
| Houma | 0.0 /100 | #331 | Tragic 79.9% |
| Kiowa | 0.0 /100 | #332 | Tragic 79.8% |
| Inupiat | 0.0 /100 | #333 | Tragic 79.7% |
| Hopi | 0.0 /100 | #334 | Tragic 79.3% |
| Marshallese | 0.0 /100 | #335 | Tragic 79.2% |
| Natives/Alaskans | 0.0 /100 | #336 | Tragic 79.2% |
| Yakama | 0.0 /100 | #337 | Tragic 79.1% |
| Pima | 0.0 /100 | #338 | Tragic 79.0% |
| Apache | 0.0 /100 | #339 | Tragic 79.0% |