Australian vs Austrian In Labor Force | Age 20-24
COMPARE
Australian
Austrian
In Labor Force | Age 20-24
In Labor Force | Age 20-24 Comparison
Australians
Austrians
75.5%
IN LABOR FORCE | AGE 20-24
84.8/ 100
METRIC RATING
138th/ 347
METRIC RANK
76.5%
IN LABOR FORCE | AGE 20-24
99.4/ 100
METRIC RATING
84th/ 347
METRIC RANK
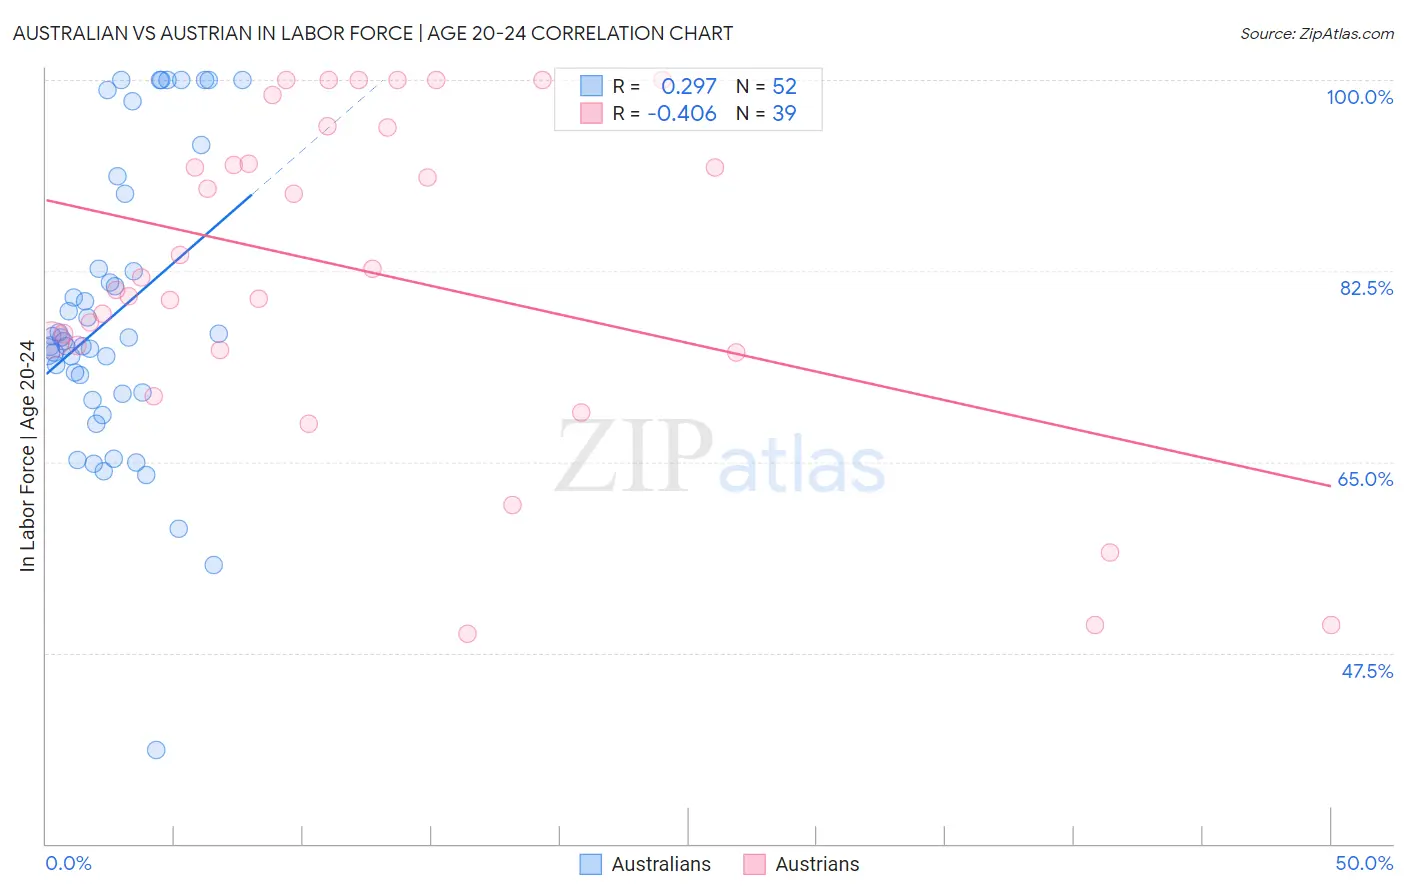
Australian vs Austrian In Labor Force | Age 20-24 Correlation Chart
The statistical analysis conducted on geographies consisting of 224,080,668 people shows a weak positive correlation between the proportion of Australians and labor force participation rate among population between the ages 20 and 24 in the United States with a correlation coefficient (R) of 0.297 and weighted average of 75.5%. Similarly, the statistical analysis conducted on geographies consisting of 451,655,464 people shows a moderate negative correlation between the proportion of Austrians and labor force participation rate among population between the ages 20 and 24 in the United States with a correlation coefficient (R) of -0.406 and weighted average of 76.5%, a difference of 1.2%.
In Labor Force | Age 20-24 Correlation Summary
| Measurement | Australian | Austrian |
| Minimum | 38.6% | 49.2% |
| Maximum | 100.0% | 100.0% |
| Range | 61.4% | 50.8% |
| Mean | 78.6% | 82.3% |
| Median | 76.2% | 81.9% |
| Interquartile 25% (IQ1) | 71.3% | 75.3% |
| Interquartile 75% (IQ3) | 86.1% | 95.6% |
| Interquartile Range (IQR) | 14.8% | 20.3% |
| Standard Deviation (Sample) | 13.5% | 14.9% |
| Standard Deviation (Population) | 13.3% | 14.7% |
Similar Demographics by In Labor Force | Age 20-24
Demographics Similar to Australians by In Labor Force | Age 20-24
In terms of in labor force | age 20-24, the demographic groups most similar to Australians are Immigrants from Brazil (75.5%, a difference of 0.0%), Jordanian (75.5%, a difference of 0.0%), Immigrants from England (75.5%, a difference of 0.010%), Delaware (75.5%, a difference of 0.010%), and Yaqui (75.5%, a difference of 0.020%).
| Demographics | Rating | Rank | In Labor Force | Age 20-24 |
| Immigrants | Jordan | 88.5 /100 | #131 | Excellent 75.6% |
| Palestinians | 88.4 /100 | #132 | Excellent 75.6% |
| Zimbabweans | 88.2 /100 | #133 | Excellent 75.6% |
| Estonians | 87.1 /100 | #134 | Excellent 75.6% |
| Yaqui | 85.5 /100 | #135 | Excellent 75.5% |
| Immigrants | Brazil | 84.8 /100 | #136 | Excellent 75.5% |
| Jordanians | 84.8 /100 | #137 | Excellent 75.5% |
| Australians | 84.8 /100 | #138 | Excellent 75.5% |
| Immigrants | England | 84.6 /100 | #139 | Excellent 75.5% |
| Delaware | 84.5 /100 | #140 | Excellent 75.5% |
| Romanians | 84.1 /100 | #141 | Excellent 75.5% |
| Blackfeet | 83.6 /100 | #142 | Excellent 75.5% |
| Spaniards | 82.0 /100 | #143 | Excellent 75.5% |
| Bhutanese | 80.8 /100 | #144 | Excellent 75.4% |
| Koreans | 79.7 /100 | #145 | Good 75.4% |
Demographics Similar to Austrians by In Labor Force | Age 20-24
In terms of in labor force | age 20-24, the demographic groups most similar to Austrians are Carpatho Rusyn (76.5%, a difference of 0.010%), Portuguese (76.4%, a difference of 0.030%), Immigrants from Iraq (76.4%, a difference of 0.050%), Immigrants from Thailand (76.4%, a difference of 0.050%), and Basque (76.5%, a difference of 0.10%).
| Demographics | Rating | Rank | In Labor Force | Age 20-24 |
| Immigrants | Cameroon | 99.6 /100 | #77 | Exceptional 76.6% |
| Canadians | 99.6 /100 | #78 | Exceptional 76.6% |
| Immigrants | Zaire | 99.6 /100 | #79 | Exceptional 76.6% |
| Italians | 99.6 /100 | #80 | Exceptional 76.5% |
| Basques | 99.5 /100 | #81 | Exceptional 76.5% |
| Hmong | 99.5 /100 | #82 | Exceptional 76.5% |
| Carpatho Rusyns | 99.4 /100 | #83 | Exceptional 76.5% |
| Austrians | 99.4 /100 | #84 | Exceptional 76.5% |
| Portuguese | 99.3 /100 | #85 | Exceptional 76.4% |
| Immigrants | Iraq | 99.3 /100 | #86 | Exceptional 76.4% |
| Immigrants | Thailand | 99.3 /100 | #87 | Exceptional 76.4% |
| Spanish | 99.2 /100 | #88 | Exceptional 76.4% |
| Bulgarians | 99.2 /100 | #89 | Exceptional 76.4% |
| Immigrants | Burma/Myanmar | 99.1 /100 | #90 | Exceptional 76.3% |
| Sierra Leoneans | 99.0 /100 | #91 | Exceptional 76.3% |