Northern European vs Immigrants from Serbia In Labor Force | Age 20-64

COMPARE

Northern European
Race
Ancestry
AfghanAfricanAlaska NativeAlaskan AthabascanAlbanianAleutAlsatianAmericanApacheArabArapahoArgentineanArmenianAssyrian/Chaldean/SyriacAustralianAustrianBahamianBangladeshiBarbadianBasqueBelgianBelizeanBermudanBhutaneseBlackfeetBolivianBrazilianBritishBritish West IndianBulgarianBurmeseCajunCambodianCanadianCape VerdeanCarpatho RusynCelticCentral AmericanCentral American IndianCherokeeCheyenneChickasawChileanChineseChippewaChoctawColombianColvilleComancheCosta RicanCreeCreekCroatianCrowCubanCypriotCzechCzechoslovakianDanishDelawareDominicanDutchDutch West IndianEastern EuropeanEcuadorianEgyptianEnglishEstonianEthiopianEuropeanFijianFilipinoFinnishFrenchFrench American IndianFrench CanadianGermanGerman RussianGhanaianGreekGuamanian/ChamorroGuatemalanGuyaneseHaitianHmongHonduranHopiHoumaHungarianIcelanderIndian (Asian)IndonesianInupiatIranianIraqiIrishIroquoisIsraeliItalianJamaicanJapaneseJordanianKenyanKiowaKoreanLaotianLatvianLebaneseLiberianLithuanianLumbeeLuxembourgerMacedonianMalaysianMalteseMarshalleseMenomineeMexicanMexican American IndianMongolianMoroccanNative HawaiianNavajoNepaleseNew ZealanderNicaraguanNigerianNorthern EuropeanNorwegianOkinawanOsageOttawaPaiutePakistaniPalestinianPanamanianParaguayanPennsylvania GermanPeruvianPimaPolishPortuguesePotawatomiPuebloPuerto RicanPuget Sound SalishRomanianRussianSalvadoranSamoanScandinavianScotch-IrishScottishSeminoleSenegaleseSerbianShoshoneSierra LeoneanSiouxSlavicSlovakSloveneSomaliSouth AfricanSouth AmericanSouth American IndianSoviet UnionSpaniardSpanishSpanish AmericanSpanish American IndianSri LankanSubsaharan AfricanSudaneseSwedishSwissSyrianTaiwaneseThaiTlingit-HaidaTohono O'OdhamTonganTrinidadian and TobagonianTsimshianTurkishU.S. Virgin IslanderUgandanUkrainianUruguayanUteVenezuelanVietnameseWelshWest IndianYakamaYaquiYugoslavianYumanYup'ikZimbabwean
Immigration
NonimmigrantsImmigrantsAfghanistanAfricaAlbaniaArgentinaArmeniaAsiaAustraliaAustriaBahamasBangladeshBarbadosBelarusBelgiumBelizeBoliviaBosnia and HerzegovinaBrazilBulgariaBurma/MyanmarCabo VerdeCambodiaCameroonCanadaCaribbeanCentral AmericaChileChinaColombiaCongoCosta RicaCroatiaCubaCzechoslovakiaDenmarkDominicaDominican RepublicEastern AfricaEastern AsiaEastern EuropeEcuadorEgyptEl SalvadorEnglandEritreaEthiopiaEuropeFijiFranceGermanyGhanaGreeceGrenadaGuatemalaGuyanaHaitiHondurasHong KongHungaryIndiaIndonesiaIranIraqIrelandIsraelItalyJamaicaJapanJordanKazakhstanKenyaKoreaKuwaitLaosLatin AmericaLatviaLebanonLiberiaLithuaniaMalaysiaMexicoMicronesiaMiddle AfricaMoldovaMoroccoNepalNetherlandsNicaraguaNigeriaNorth AmericaNorth MacedoniaNorthern AfricaNorthern EuropeNorwayOceaniaPakistanPanamaPeruPhilippinesPolandPortugalRomaniaRussiaSaudi ArabiaScotlandSenegalSierra LeoneSingaporeSomaliaSouth AfricaSouth AmericaSouth Central AsiaSouth Eastern AsiaSouthern EuropeSpainSri LankaSt. Vincent and the GrenadinesSudanSwedenSwitzerlandSyriaTaiwanThailandTrinidad and TobagoTurkeyUgandaUkraineUruguayUzbekistanVenezuelaVietnamWest IndiesWestern AfricaWestern AsiaWestern EuropeYemenZaireZimbabweAzores
Immigrants from Serbia
Race
Ancestry
AfghanAfricanAlaska NativeAlaskan AthabascanAlbanianAleutAlsatianAmericanApacheArabArapahoArgentineanArmenianAssyrian/Chaldean/SyriacAustralianAustrianBahamianBangladeshiBarbadianBasqueBelgianBelizeanBermudanBhutaneseBlackfeetBolivianBrazilianBritishBritish West IndianBulgarianBurmeseCajunCambodianCanadianCape VerdeanCarpatho RusynCelticCentral AmericanCentral American IndianCherokeeCheyenneChickasawChileanChineseChippewaChoctawColombianColvilleComancheCosta RicanCreeCreekCroatianCrowCubanCypriotCzechCzechoslovakianDanishDelawareDominicanDutchDutch West IndianEastern EuropeanEcuadorianEgyptianEnglishEstonianEthiopianEuropeanFijianFilipinoFinnishFrenchFrench American IndianFrench CanadianGermanGerman RussianGhanaianGreekGuamanian/ChamorroGuatemalanGuyaneseHaitianHmongHonduranHopiHoumaHungarianIcelanderIndian (Asian)IndonesianInupiatIranianIraqiIrishIroquoisIsraeliItalianJamaicanJapaneseJordanianKenyanKiowaKoreanLaotianLatvianLebaneseLiberianLithuanianLumbeeLuxembourgerMacedonianMalaysianMalteseMarshalleseMenomineeMexicanMexican American IndianMongolianMoroccanNative HawaiianNavajoNepaleseNew ZealanderNicaraguanNigerianNorwegianOkinawanOsageOttawaPaiutePakistaniPalestinianPanamanianParaguayanPennsylvania GermanPeruvianPimaPolishPortuguesePotawatomiPuebloPuerto RicanPuget Sound SalishRomanianRussianSalvadoranSamoanScandinavianScotch-IrishScottishSeminoleSenegaleseSerbianShoshoneSierra LeoneanSiouxSlavicSlovakSloveneSomaliSouth AfricanSouth AmericanSouth American IndianSoviet UnionSpaniardSpanishSpanish AmericanSpanish American IndianSri LankanSubsaharan AfricanSudaneseSwedishSwissSyrianTaiwaneseThaiTlingit-HaidaTohono O'OdhamTonganTrinidadian and TobagonianTsimshianTurkishU.S. Virgin IslanderUgandanUkrainianUruguayanUteVenezuelanVietnameseWelshWest IndianYakamaYaquiYugoslavianYumanYup'ikZimbabwean
Immigration
NonimmigrantsImmigrantsAfghanistanAfricaAlbaniaArgentinaArmeniaAsiaAustraliaAustriaBahamasBangladeshBarbadosBelarusBelgiumBelizeBoliviaBosnia and HerzegovinaBrazilBulgariaBurma/MyanmarCabo VerdeCambodiaCameroonCanadaCaribbeanCentral AmericaChileChinaColombiaCongoCosta RicaCroatiaCubaCzechoslovakiaDenmarkDominicaDominican RepublicEastern AfricaEastern AsiaEastern EuropeEcuadorEgyptEl SalvadorEnglandEritreaEthiopiaEuropeFijiFranceGermanyGhanaGreeceGrenadaGuatemalaGuyanaHaitiHondurasHong KongHungaryIndiaIndonesiaIranIraqIrelandIsraelItalyJamaicaJapanJordanKazakhstanKenyaKoreaKuwaitLaosLatin AmericaLatviaLebanonLiberiaLithuaniaMalaysiaMexicoMicronesiaMiddle AfricaMoldovaMoroccoNepalNetherlandsNicaraguaNigeriaNorth AmericaNorth MacedoniaNorthern AfricaNorthern EuropeNorwayOceaniaPakistanPanamaPeruPhilippinesPolandPortugalRomaniaRussiaSaudi ArabiaScotlandSenegalSerbiaSierra LeoneSingaporeSomaliaSouth AfricaSouth AmericaSouth Central AsiaSouth Eastern AsiaSouthern EuropeSpainSri LankaSt. Vincent and the GrenadinesSudanSwedenSwitzerlandSyriaTaiwanThailandTrinidad and TobagoTurkeyUgandaUkraineUruguayUzbekistanVenezuelaVietnamWest IndiesWestern AfricaWestern AsiaWestern EuropeYemenZaireZimbabweAzores
In Labor Force | Age 20-64
Income
Poverty
Unemployment
Labor Participation
Family Structure
Vehicle Availability
Education Level
Disability

In Labor Force | Age 20-64 Comparison

Northern Europeans

Immigrants from Serbia

Fair
Exceptional
79.5%
IN LABOR FORCE | AGE 20-64
34.5/ 100
METRIC RATING
186th/ 347
METRIC RANK
80.8%
IN LABOR FORCE | AGE 20-64
100.0/ 100
METRIC RATING
26th/ 347
METRIC RANK

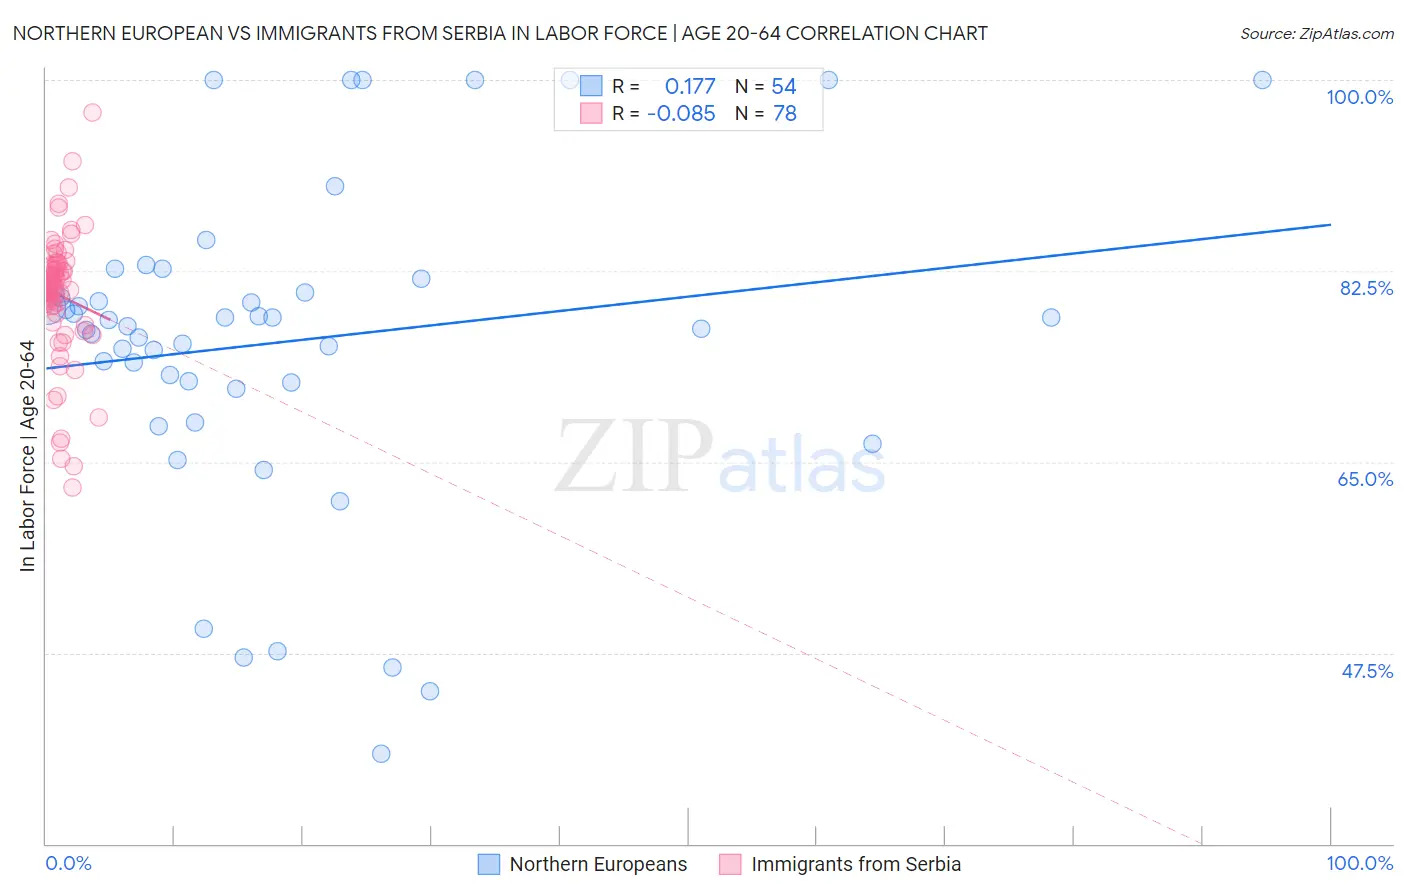
Northern European vs Immigrants from Serbia In Labor Force | Age 20-64 Correlation Chart

The statistical analysis conducted on geographies consisting of 406,102,116 people shows a poor positive correlation between the proportion of Northern Europeans and labor force participation rate among population between the ages 20 and 64 in the United States with a correlation coefficient (R) of 0.177 and weighted average of 79.5%. Similarly, the statistical analysis conducted on geographies consisting of 131,747,619 people shows a slight negative correlation between the proportion of Immigrants from Serbia and labor force participation rate among population between the ages 20 and 64 in the United States with a correlation coefficient (R) of -0.085 and weighted average of 80.8%, a difference of 1.7%.
Northern European vs Immigrants from Serbia In Labor Force | Age 20-64

In Labor Force | Age 20-64 Correlation Summary

MeasurementNorthern EuropeanImmigrants from Serbia
Minimum38.3%62.6%
Maximum100.0%97.0%
Range61.7%34.4%
Mean76.0%80.3%
Median77.7%81.1%
Interquartile 25% (IQ1)72.3%79.2%
Interquartile 75% (IQ3)80.5%83.1%
Interquartile Range (IQR)8.2%3.8%
Standard Deviation (Sample)14.4%5.9%
Standard Deviation (Population)14.3%5.8%

Similar Demographics by In Labor Force | Age 20-64

Demographics Similar to Northern Europeans by In Labor Force | Age 20-64

In terms of in labor force | age 20-64, the demographic groups most similar to Northern Europeans are Israeli (79.5%, a difference of 0.0%), Finnish (79.5%, a difference of 0.010%), Assyrian/Chaldean/Syriac (79.4%, a difference of 0.010%), Malaysian (79.5%, a difference of 0.020%), and Immigrants from Hungary (79.5%, a difference of 0.020%).
DemographicsRating | RankIn Labor Force | Age 20-64
Armenians
41.4
/100
|
#179
Average
79.5%
Salvadorans
41.0
/100
|
#180
Average
79.5%
Immigrants | Saudi Arabia
37.7
/100
|
#181
Fair
79.5%
Malaysians
37.1
/100
|
#182
Fair
79.5%
Immigrants | Hungary
36.8
/100
|
#183
Fair
79.5%
Finns
35.9
/100
|
#184
Fair
79.5%
Israelis
34.7
/100
|
#185
Fair
79.5%
Northern Europeans
34.5
/100
|
#186
Fair
79.5%
Assyrians/Chaldeans/Syriacs
33.3
/100
|
#187
Fair
79.4%
Immigrants | Haiti
32.1
/100
|
#188
Fair
79.4%
Immigrants | El Salvador
30.9
/100
|
#189
Fair
79.4%
Immigrants | Syria
30.8
/100
|
#190
Fair
79.4%
Swiss
28.9
/100
|
#191
Fair
79.4%
Immigrants | Denmark
26.9
/100
|
#192
Fair
79.4%
Indonesians
26.1
/100
|
#193
Fair
79.4%

Demographics Similar to Immigrants from Serbia by In Labor Force | Age 20-64

In terms of in labor force | age 20-64, the demographic groups most similar to Immigrants from Serbia are Kenyan (80.8%, a difference of 0.020%), Immigrants from Morocco (80.8%, a difference of 0.030%), Immigrants from Bosnia and Herzegovina (80.8%, a difference of 0.040%), Sudanese (80.8%, a difference of 0.050%), and Immigrants from Kenya (80.7%, a difference of 0.070%).
DemographicsRating | RankIn Labor Force | Age 20-64
Zimbabweans
100.0
/100
|
#19
Exceptional
81.0%
Thais
100.0
/100
|
#20
Exceptional
80.9%
Liberians
100.0
/100
|
#21
Exceptional
80.9%
Sudanese
100.0
/100
|
#22
Exceptional
80.8%
Immigrants | Bosnia and Herzegovina
100.0
/100
|
#23
Exceptional
80.8%
Immigrants | Morocco
100.0
/100
|
#24
Exceptional
80.8%
Kenyans
100.0
/100
|
#25
Exceptional
80.8%
Immigrants | Serbia
100.0
/100
|
#26
Exceptional
80.8%
Immigrants | Kenya
99.9
/100
|
#27
Exceptional
80.7%
Immigrants | Uganda
99.9
/100
|
#28
Exceptional
80.7%
Immigrants | South Central Asia
99.9
/100
|
#29
Exceptional
80.7%
Immigrants | North Macedonia
99.9
/100
|
#30
Exceptional
80.7%
Immigrants | Lithuania
99.9
/100
|
#31
Exceptional
80.7%
Immigrants | Ireland
99.9
/100
|
#32
Exceptional
80.7%
Chinese
99.9
/100
|
#33
Exceptional
80.7%