Scandinavian vs Spanish In Labor Force | Age 25-29
COMPARE
Scandinavian
Spanish
In Labor Force | Age 25-29
In Labor Force | Age 25-29 Comparison
Scandinavians
Spanish
84.9%
IN LABOR FORCE | AGE 25-29
85.1/ 100
METRIC RATING
122nd/ 347
METRIC RANK
83.6%
IN LABOR FORCE | AGE 25-29
0.1/ 100
METRIC RATING
259th/ 347
METRIC RANK
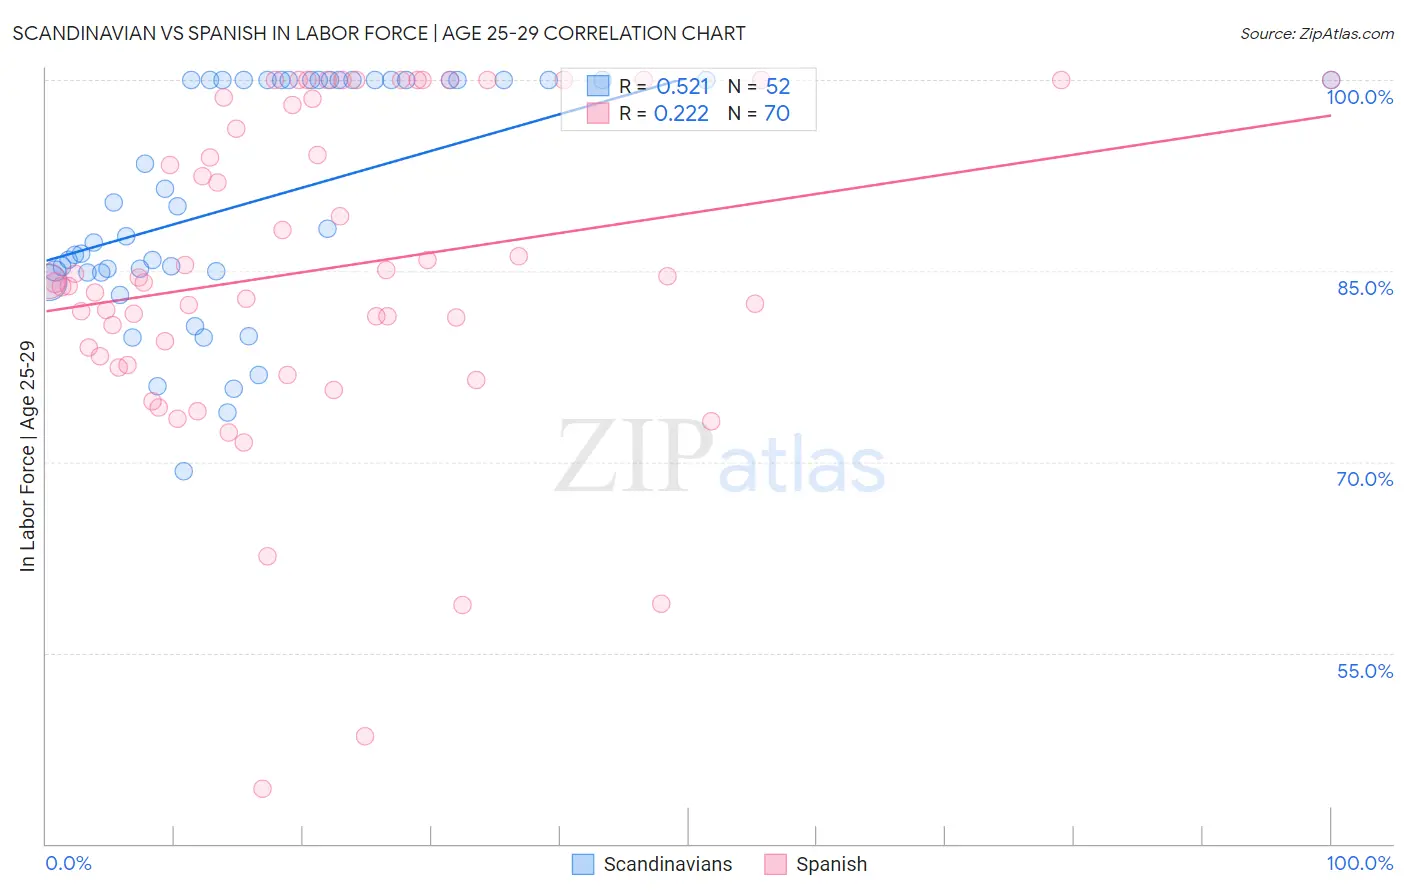
Scandinavian vs Spanish In Labor Force | Age 25-29 Correlation Chart
The statistical analysis conducted on geographies consisting of 472,219,125 people shows a substantial positive correlation between the proportion of Scandinavians and labor force participation rate among population between the ages 25 and 29 in the United States with a correlation coefficient (R) of 0.521 and weighted average of 84.9%. Similarly, the statistical analysis conducted on geographies consisting of 421,954,329 people shows a weak positive correlation between the proportion of Spanish and labor force participation rate among population between the ages 25 and 29 in the United States with a correlation coefficient (R) of 0.222 and weighted average of 83.6%, a difference of 1.6%.
In Labor Force | Age 25-29 Correlation Summary
| Measurement | Scandinavian | Spanish |
| Minimum | 69.3% | 44.3% |
| Maximum | 100.0% | 100.0% |
| Range | 30.7% | 55.7% |
| Mean | 90.6% | 85.1% |
| Median | 89.2% | 84.1% |
| Interquartile 25% (IQ1) | 85.0% | 78.3% |
| Interquartile 75% (IQ3) | 100.0% | 98.6% |
| Interquartile Range (IQR) | 15.0% | 20.3% |
| Standard Deviation (Sample) | 9.1% | 12.6% |
| Standard Deviation (Population) | 9.0% | 12.5% |
Similar Demographics by In Labor Force | Age 25-29
Demographics Similar to Scandinavians by In Labor Force | Age 25-29
In terms of in labor force | age 25-29, the demographic groups most similar to Scandinavians are Dutch (84.9%, a difference of 0.0%), Immigrants from Iran (84.9%, a difference of 0.0%), Immigrants from South Africa (84.9%, a difference of 0.010%), Immigrants from Chile (84.9%, a difference of 0.010%), and Uruguayan (84.9%, a difference of 0.010%).
| Demographics | Rating | Rank | In Labor Force | Age 25-29 |
| South Africans | 88.9 /100 | #115 | Excellent 85.0% |
| Chileans | 88.8 /100 | #116 | Excellent 85.0% |
| Immigrants | Belarus | 88.0 /100 | #117 | Excellent 85.0% |
| Finns | 87.8 /100 | #118 | Excellent 85.0% |
| Filipinos | 87.1 /100 | #119 | Excellent 84.9% |
| Immigrants | South Africa | 86.1 /100 | #120 | Excellent 84.9% |
| Immigrants | Chile | 85.6 /100 | #121 | Excellent 84.9% |
| Scandinavians | 85.1 /100 | #122 | Excellent 84.9% |
| Dutch | 84.9 /100 | #123 | Excellent 84.9% |
| Immigrants | Iran | 84.8 /100 | #124 | Excellent 84.9% |
| Uruguayans | 84.7 /100 | #125 | Excellent 84.9% |
| Immigrants | Singapore | 84.4 /100 | #126 | Excellent 84.9% |
| Immigrants | Uruguay | 84.0 /100 | #127 | Excellent 84.9% |
| Australians | 83.6 /100 | #128 | Excellent 84.9% |
| Immigrants | Russia | 81.6 /100 | #129 | Excellent 84.9% |
Demographics Similar to Spanish by In Labor Force | Age 25-29
In terms of in labor force | age 25-29, the demographic groups most similar to Spanish are Immigrants from Guatemala (83.6%, a difference of 0.010%), Immigrants from Bahamas (83.6%, a difference of 0.010%), Pennsylvania German (83.6%, a difference of 0.010%), Immigrants from Haiti (83.7%, a difference of 0.050%), and Delaware (83.7%, a difference of 0.050%).
| Demographics | Rating | Rank | In Labor Force | Age 25-29 |
| Guatemalans | 0.2 /100 | #252 | Tragic 83.7% |
| Immigrants | Trinidad and Tobago | 0.2 /100 | #253 | Tragic 83.7% |
| Spaniards | 0.2 /100 | #254 | Tragic 83.7% |
| Haitians | 0.2 /100 | #255 | Tragic 83.7% |
| Immigrants | Haiti | 0.2 /100 | #256 | Tragic 83.7% |
| Delaware | 0.2 /100 | #257 | Tragic 83.7% |
| Immigrants | Guatemala | 0.1 /100 | #258 | Tragic 83.6% |
| Spanish | 0.1 /100 | #259 | Tragic 83.6% |
| Immigrants | Bahamas | 0.1 /100 | #260 | Tragic 83.6% |
| Pennsylvania Germans | 0.1 /100 | #261 | Tragic 83.6% |
| Immigrants | Fiji | 0.1 /100 | #262 | Tragic 83.6% |
| West Indians | 0.1 /100 | #263 | Tragic 83.5% |
| Puget Sound Salish | 0.1 /100 | #264 | Tragic 83.5% |
| Cubans | 0.1 /100 | #265 | Tragic 83.5% |
| Aleuts | 0.0 /100 | #266 | Tragic 83.4% |