Scandinavian vs Spanish Single Mother Poverty
COMPARE
Scandinavian
Spanish
Single Mother Poverty
Single Mother Poverty Comparison
Scandinavians
Spanish
28.9%
SINGLE MOTHER POVERTY
66.2/ 100
METRIC RATING
162nd/ 347
METRIC RANK
30.1%
SINGLE MOTHER POVERTY
6.3/ 100
METRIC RATING
225th/ 347
METRIC RANK
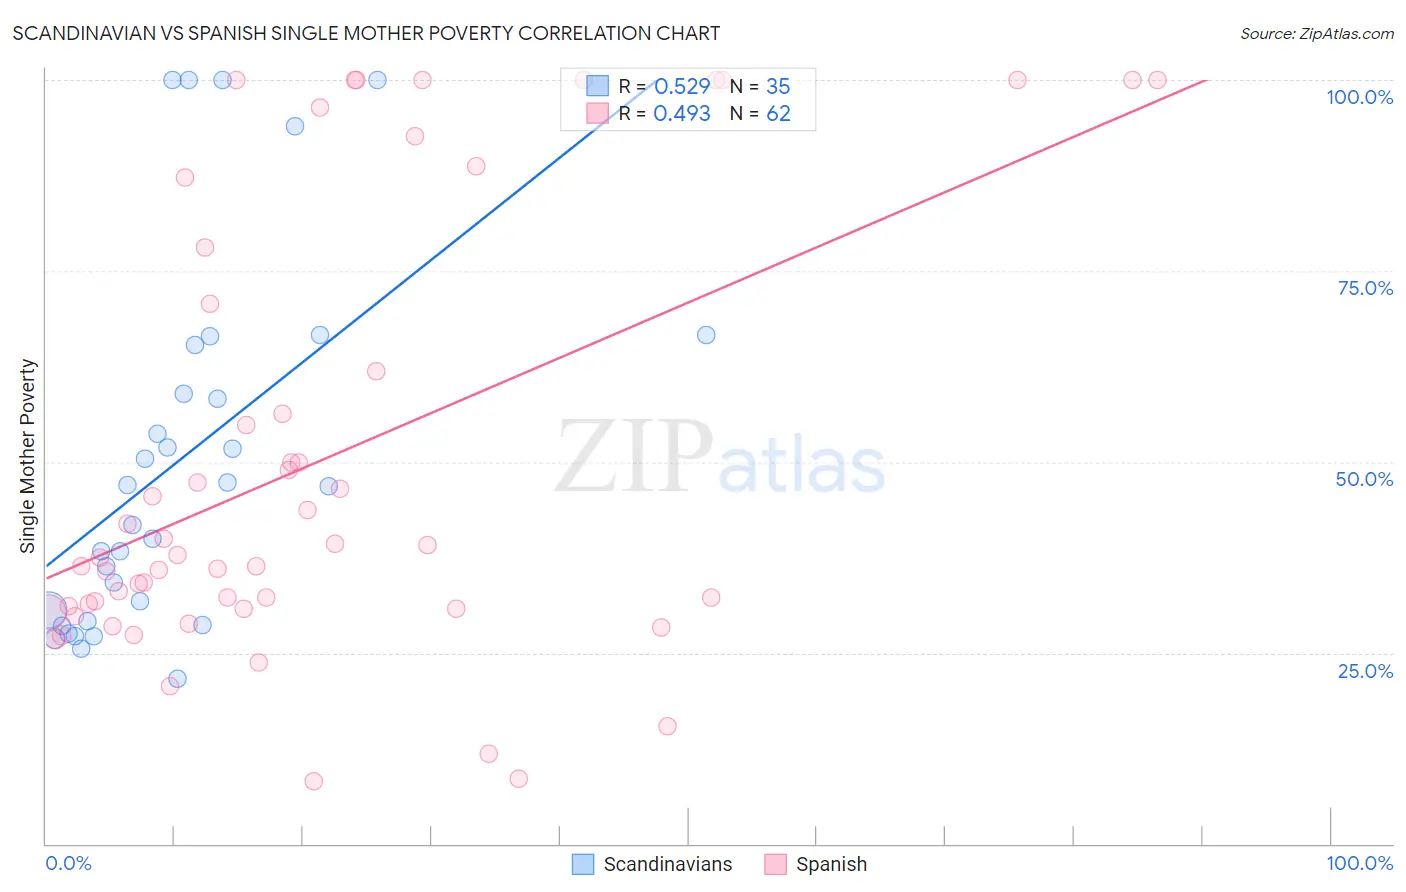
Scandinavian vs Spanish Single Mother Poverty Correlation Chart
The statistical analysis conducted on geographies consisting of 456,235,845 people shows a substantial positive correlation between the proportion of Scandinavians and poverty level among single mothers in the United States with a correlation coefficient (R) of 0.529 and weighted average of 28.9%. Similarly, the statistical analysis conducted on geographies consisting of 411,729,340 people shows a moderate positive correlation between the proportion of Spanish and poverty level among single mothers in the United States with a correlation coefficient (R) of 0.493 and weighted average of 30.1%, a difference of 4.1%.
Single Mother Poverty Correlation Summary
| Measurement | Scandinavian | Spanish |
| Minimum | 21.6% | 8.1% |
| Maximum | 100.0% | 100.0% |
| Range | 78.4% | 91.9% |
| Mean | 50.2% | 50.1% |
| Median | 46.8% | 37.7% |
| Interquartile 25% (IQ1) | 29.1% | 30.8% |
| Interquartile 75% (IQ3) | 65.3% | 70.7% |
| Interquartile Range (IQR) | 36.2% | 39.9% |
| Standard Deviation (Sample) | 24.0% | 28.6% |
| Standard Deviation (Population) | 23.7% | 28.4% |
Similar Demographics by Single Mother Poverty
Demographics Similar to Scandinavians by Single Mother Poverty
In terms of single mother poverty, the demographic groups most similar to Scandinavians are Immigrants from Cambodia (28.9%, a difference of 0.020%), Immigrants from Nigeria (28.9%, a difference of 0.020%), Immigrants from Kenya (28.9%, a difference of 0.020%), Japanese (28.9%, a difference of 0.10%), and Czech (28.9%, a difference of 0.12%).
| Demographics | Rating | Rank | Single Mother Poverty |
| Ugandans | 71.7 /100 | #155 | Good 28.8% |
| Iraqis | 71.5 /100 | #156 | Good 28.8% |
| Immigrants | Western Europe | 71.1 /100 | #157 | Good 28.9% |
| Immigrants | Hungary | 70.6 /100 | #158 | Good 28.9% |
| Czechs | 68.4 /100 | #159 | Good 28.9% |
| Japanese | 68.0 /100 | #160 | Good 28.9% |
| Immigrants | Cambodia | 66.6 /100 | #161 | Good 28.9% |
| Scandinavians | 66.2 /100 | #162 | Good 28.9% |
| Immigrants | Nigeria | 65.9 /100 | #163 | Good 28.9% |
| Immigrants | Kenya | 65.9 /100 | #164 | Good 28.9% |
| Arabs | 60.7 /100 | #165 | Good 29.0% |
| Inupiat | 60.4 /100 | #166 | Good 29.0% |
| Costa Ricans | 58.4 /100 | #167 | Average 29.0% |
| Europeans | 57.6 /100 | #168 | Average 29.1% |
| Immigrants | Uruguay | 57.2 /100 | #169 | Average 29.1% |
Demographics Similar to Spanish by Single Mother Poverty
In terms of single mother poverty, the demographic groups most similar to Spanish are Immigrants from Sudan (30.1%, a difference of 0.030%), Scottish (30.1%, a difference of 0.060%), Immigrants from Liberia (30.1%, a difference of 0.090%), Immigrants from Cuba (30.1%, a difference of 0.10%), and Spaniard (30.2%, a difference of 0.20%).
| Demographics | Rating | Rank | Single Mother Poverty |
| Hungarians | 10.3 /100 | #218 | Poor 29.9% |
| Finns | 9.3 /100 | #219 | Tragic 30.0% |
| Germans | 8.8 /100 | #220 | Tragic 30.0% |
| Immigrants | Eritrea | 7.7 /100 | #221 | Tragic 30.0% |
| Sudanese | 7.6 /100 | #222 | Tragic 30.0% |
| Immigrants | Cuba | 6.9 /100 | #223 | Tragic 30.1% |
| Immigrants | Sudan | 6.5 /100 | #224 | Tragic 30.1% |
| Spanish | 6.3 /100 | #225 | Tragic 30.1% |
| Scottish | 6.0 /100 | #226 | Tragic 30.1% |
| Immigrants | Liberia | 5.9 /100 | #227 | Tragic 30.1% |
| Spaniards | 5.4 /100 | #228 | Tragic 30.2% |
| Immigrants | Barbados | 5.0 /100 | #229 | Tragic 30.2% |
| English | 4.8 /100 | #230 | Tragic 30.2% |
| Dutch | 4.3 /100 | #231 | Tragic 30.2% |
| Alaskan Athabascans | 4.1 /100 | #232 | Tragic 30.3% |