Immigrants from Sri Lanka vs Maltese In Labor Force | Age 45-54
COMPARE
Immigrants from Sri Lanka
Maltese
In Labor Force | Age 45-54
In Labor Force | Age 45-54 Comparison
Immigrants from Sri Lanka
Maltese
83.9%
IN LABOR FORCE | AGE 45-54
99.8/ 100
METRIC RATING
21st/ 347
METRIC RANK
83.3%
IN LABOR FORCE | AGE 45-54
94.4/ 100
METRIC RATING
98th/ 347
METRIC RANK
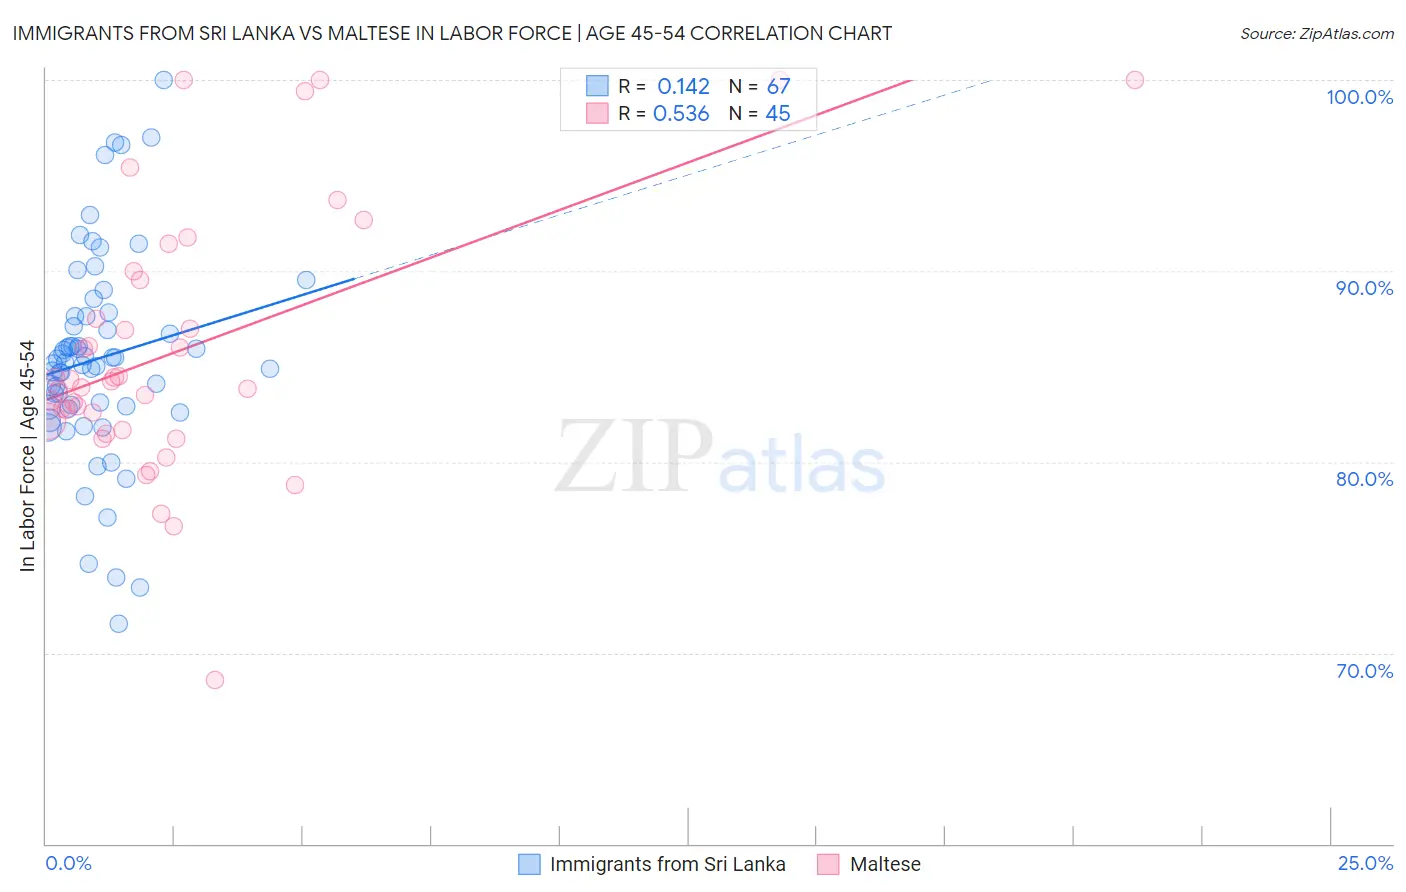
Immigrants from Sri Lanka vs Maltese In Labor Force | Age 45-54 Correlation Chart
The statistical analysis conducted on geographies consisting of 149,657,644 people shows a poor positive correlation between the proportion of Immigrants from Sri Lanka and labor force participation rate among population between the ages 45 and 54 in the United States with a correlation coefficient (R) of 0.142 and weighted average of 83.9%. Similarly, the statistical analysis conducted on geographies consisting of 126,435,946 people shows a substantial positive correlation between the proportion of Maltese and labor force participation rate among population between the ages 45 and 54 in the United States with a correlation coefficient (R) of 0.536 and weighted average of 83.3%, a difference of 0.77%.
In Labor Force | Age 45-54 Correlation Summary
| Measurement | Immigrants from Sri Lanka | Maltese |
| Minimum | 71.5% | 68.6% |
| Maximum | 100.0% | 100.0% |
| Range | 28.5% | 31.4% |
| Mean | 85.4% | 85.9% |
| Median | 85.2% | 84.2% |
| Interquartile 25% (IQ1) | 82.8% | 81.9% |
| Interquartile 75% (IQ3) | 87.6% | 89.8% |
| Interquartile Range (IQR) | 4.8% | 7.9% |
| Standard Deviation (Sample) | 5.4% | 6.9% |
| Standard Deviation (Population) | 5.4% | 6.8% |
Similar Demographics by In Labor Force | Age 45-54
Demographics Similar to Immigrants from Sri Lanka by In Labor Force | Age 45-54
In terms of in labor force | age 45-54, the demographic groups most similar to Immigrants from Sri Lanka are Immigrants from Eastern Africa (83.9%, a difference of 0.0%), Immigrants from Ireland (83.9%, a difference of 0.0%), Czech (83.9%, a difference of 0.010%), Tlingit-Haida (83.9%, a difference of 0.010%), and Slovene (83.9%, a difference of 0.010%).
| Demographics | Rating | Rank | In Labor Force | Age 45-54 |
| Cambodians | 99.9 /100 | #14 | Exceptional 84.1% |
| Cypriots | 99.9 /100 | #15 | Exceptional 84.1% |
| Immigrants | Nepal | 99.9 /100 | #16 | Exceptional 84.0% |
| Zimbabweans | 99.9 /100 | #17 | Exceptional 84.0% |
| Immigrants | South Central Asia | 99.9 /100 | #18 | Exceptional 84.0% |
| Czechs | 99.8 /100 | #19 | Exceptional 83.9% |
| Immigrants | Eastern Africa | 99.8 /100 | #20 | Exceptional 83.9% |
| Immigrants | Sri Lanka | 99.8 /100 | #21 | Exceptional 83.9% |
| Immigrants | Ireland | 99.8 /100 | #22 | Exceptional 83.9% |
| Tlingit-Haida | 99.8 /100 | #23 | Exceptional 83.9% |
| Slovenes | 99.8 /100 | #24 | Exceptional 83.9% |
| Immigrants | North Macedonia | 99.8 /100 | #25 | Exceptional 83.9% |
| Immigrants | Serbia | 99.8 /100 | #26 | Exceptional 83.9% |
| Immigrants | Brazil | 99.8 /100 | #27 | Exceptional 83.9% |
| Immigrants | Lithuania | 99.8 /100 | #28 | Exceptional 83.9% |
Demographics Similar to Maltese by In Labor Force | Age 45-54
In terms of in labor force | age 45-54, the demographic groups most similar to Maltese are Palestinian (83.3%, a difference of 0.010%), Immigrants from Middle Africa (83.3%, a difference of 0.010%), Mongolian (83.3%, a difference of 0.010%), Immigrants from Belarus (83.3%, a difference of 0.010%), and Argentinean (83.3%, a difference of 0.020%).
| Demographics | Rating | Rank | In Labor Force | Age 45-54 |
| South Americans | 95.5 /100 | #91 | Exceptional 83.3% |
| Danes | 95.3 /100 | #92 | Exceptional 83.3% |
| Italians | 95.1 /100 | #93 | Exceptional 83.3% |
| Argentineans | 94.9 /100 | #94 | Exceptional 83.3% |
| Immigrants | Argentina | 94.9 /100 | #95 | Exceptional 83.3% |
| Immigrants | Kuwait | 94.8 /100 | #96 | Exceptional 83.3% |
| Palestinians | 94.8 /100 | #97 | Exceptional 83.3% |
| Maltese | 94.4 /100 | #98 | Exceptional 83.3% |
| Immigrants | Middle Africa | 94.3 /100 | #99 | Exceptional 83.3% |
| Mongolians | 94.2 /100 | #100 | Exceptional 83.3% |
| Immigrants | Belarus | 94.1 /100 | #101 | Exceptional 83.3% |
| Immigrants | Singapore | 93.9 /100 | #102 | Exceptional 83.3% |
| Albanians | 93.9 /100 | #103 | Exceptional 83.3% |
| Immigrants | Romania | 93.8 /100 | #104 | Exceptional 83.3% |
| Immigrants | South America | 93.5 /100 | #105 | Exceptional 83.2% |