Scandinavian vs Immigrants from Guatemala In Labor Force | Age 35-44
COMPARE
Scandinavian
Immigrants from Guatemala
In Labor Force | Age 35-44
In Labor Force | Age 35-44 Comparison
Scandinavians
Immigrants from Guatemala
84.4%
IN LABOR FORCE | AGE 35-44
51.2/ 100
METRIC RATING
172nd/ 347
METRIC RANK
82.9%
IN LABOR FORCE | AGE 35-44
0.0/ 100
METRIC RATING
283rd/ 347
METRIC RANK
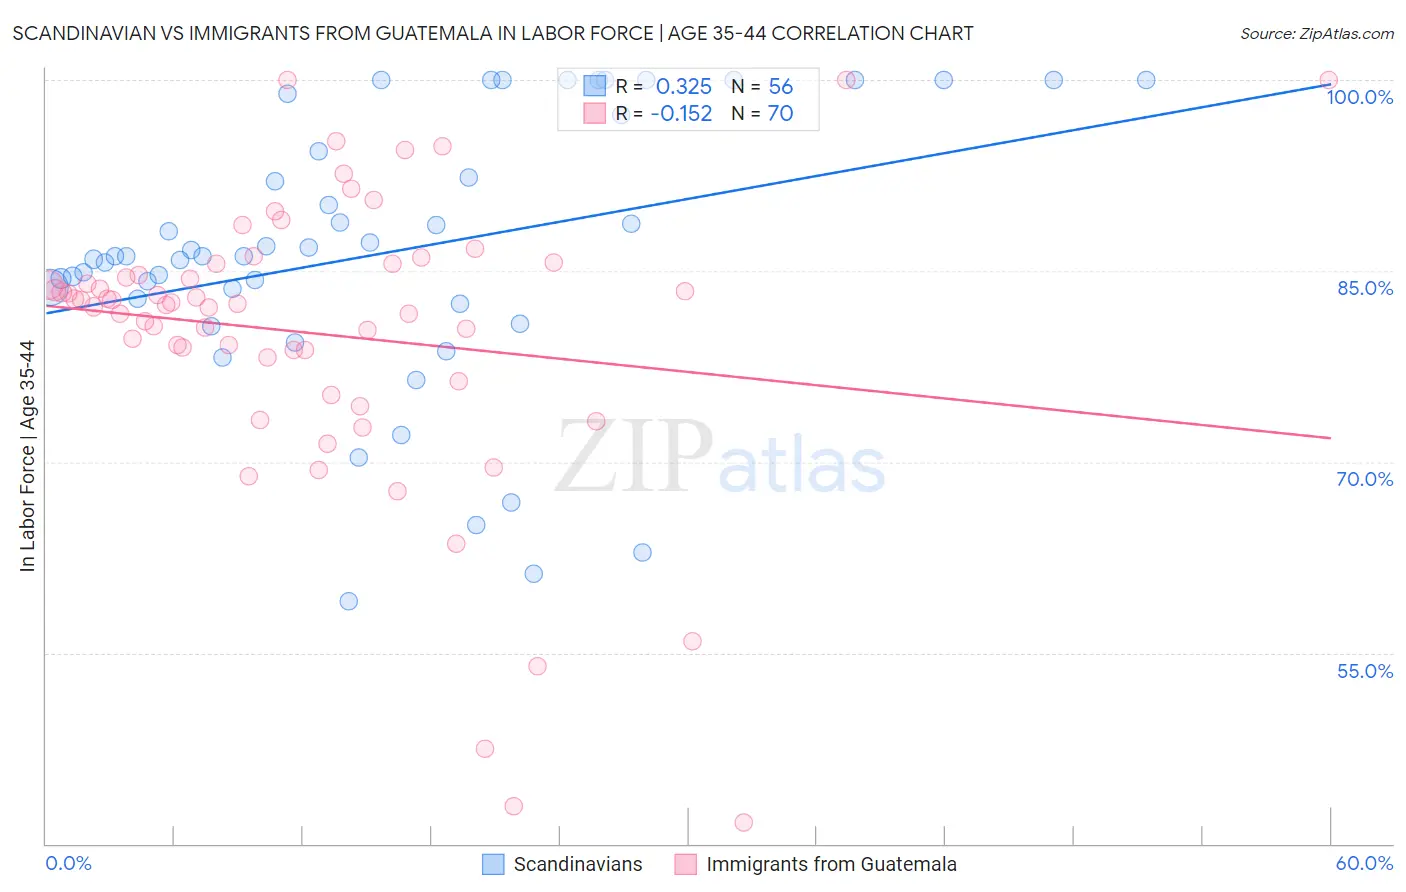
Scandinavian vs Immigrants from Guatemala In Labor Force | Age 35-44 Correlation Chart
The statistical analysis conducted on geographies consisting of 472,338,755 people shows a mild positive correlation between the proportion of Scandinavians and labor force participation rate among population between the ages 35 and 44 in the United States with a correlation coefficient (R) of 0.325 and weighted average of 84.4%. Similarly, the statistical analysis conducted on geographies consisting of 377,183,451 people shows a poor negative correlation between the proportion of Immigrants from Guatemala and labor force participation rate among population between the ages 35 and 44 in the United States with a correlation coefficient (R) of -0.152 and weighted average of 82.9%, a difference of 1.7%.
In Labor Force | Age 35-44 Correlation Summary
| Measurement | Scandinavian | Immigrants from Guatemala |
| Minimum | 59.0% | 41.7% |
| Maximum | 100.0% | 100.0% |
| Range | 41.0% | 58.3% |
| Mean | 86.4% | 80.1% |
| Median | 86.2% | 82.5% |
| Interquartile 25% (IQ1) | 82.6% | 78.2% |
| Interquartile 75% (IQ3) | 95.9% | 85.5% |
| Interquartile Range (IQR) | 13.2% | 7.3% |
| Standard Deviation (Sample) | 10.7% | 11.5% |
| Standard Deviation (Population) | 10.6% | 11.5% |
Similar Demographics by In Labor Force | Age 35-44
Demographics Similar to Scandinavians by In Labor Force | Age 35-44
In terms of in labor force | age 35-44, the demographic groups most similar to Scandinavians are Jordanian (84.4%, a difference of 0.0%), Immigrants from Trinidad and Tobago (84.4%, a difference of 0.0%), Irish (84.4%, a difference of 0.010%), Immigrants from Afghanistan (84.4%, a difference of 0.010%), and Immigrants from Jordan (84.4%, a difference of 0.010%).
| Demographics | Rating | Rank | In Labor Force | Age 35-44 |
| Venezuelans | 58.1 /100 | #165 | Average 84.4% |
| Alsatians | 55.2 /100 | #166 | Average 84.4% |
| Immigrants | Portugal | 55.2 /100 | #167 | Average 84.4% |
| Irish | 53.1 /100 | #168 | Average 84.4% |
| Immigrants | Afghanistan | 52.7 /100 | #169 | Average 84.4% |
| Immigrants | Jordan | 52.5 /100 | #170 | Average 84.4% |
| Jordanians | 51.7 /100 | #171 | Average 84.4% |
| Scandinavians | 51.2 /100 | #172 | Average 84.4% |
| Immigrants | Trinidad and Tobago | 50.7 /100 | #173 | Average 84.4% |
| Immigrants | Iran | 50.0 /100 | #174 | Average 84.4% |
| Pakistanis | 48.2 /100 | #175 | Average 84.4% |
| Sri Lankans | 47.3 /100 | #176 | Average 84.4% |
| French Canadians | 44.3 /100 | #177 | Average 84.3% |
| Northern Europeans | 44.1 /100 | #178 | Average 84.3% |
| Immigrants | South Africa | 42.8 /100 | #179 | Average 84.3% |
Demographics Similar to Immigrants from Guatemala by In Labor Force | Age 35-44
In terms of in labor force | age 35-44, the demographic groups most similar to Immigrants from Guatemala are Osage (82.9%, a difference of 0.0%), Immigrants from Dominican Republic (82.9%, a difference of 0.010%), Fijian (82.9%, a difference of 0.020%), Immigrants from Bangladesh (82.9%, a difference of 0.020%), and Immigrants from Belize (82.9%, a difference of 0.030%).
| Demographics | Rating | Rank | In Labor Force | Age 35-44 |
| Delaware | 0.0 /100 | #276 | Tragic 83.2% |
| Samoans | 0.0 /100 | #277 | Tragic 83.2% |
| Belizeans | 0.0 /100 | #278 | Tragic 83.1% |
| Immigrants | Micronesia | 0.0 /100 | #279 | Tragic 83.1% |
| Dominicans | 0.0 /100 | #280 | Tragic 83.1% |
| Guatemalans | 0.0 /100 | #281 | Tragic 83.0% |
| Osage | 0.0 /100 | #282 | Tragic 82.9% |
| Immigrants | Guatemala | 0.0 /100 | #283 | Tragic 82.9% |
| Immigrants | Dominican Republic | 0.0 /100 | #284 | Tragic 82.9% |
| Fijians | 0.0 /100 | #285 | Tragic 82.9% |
| Immigrants | Bangladesh | 0.0 /100 | #286 | Tragic 82.9% |
| Immigrants | Belize | 0.0 /100 | #287 | Tragic 82.9% |
| Puget Sound Salish | 0.0 /100 | #288 | Tragic 82.9% |
| Chippewa | 0.0 /100 | #289 | Tragic 82.9% |
| Africans | 0.0 /100 | #290 | Tragic 82.9% |